Turkish vs Slovak Disability Age 5 to 17
COMPARE
Turkish
Slovak
Disability Age 5 to 17
Disability Age 5 to 17 Comparison
Turks
Slovaks
5.1%
DISABILITY AGE 5 TO 17
99.9/ 100
METRIC RATING
51st/ 347
METRIC RANK
6.5%
DISABILITY AGE 5 TO 17
0.0/ 100
METRIC RATING
322nd/ 347
METRIC RANK
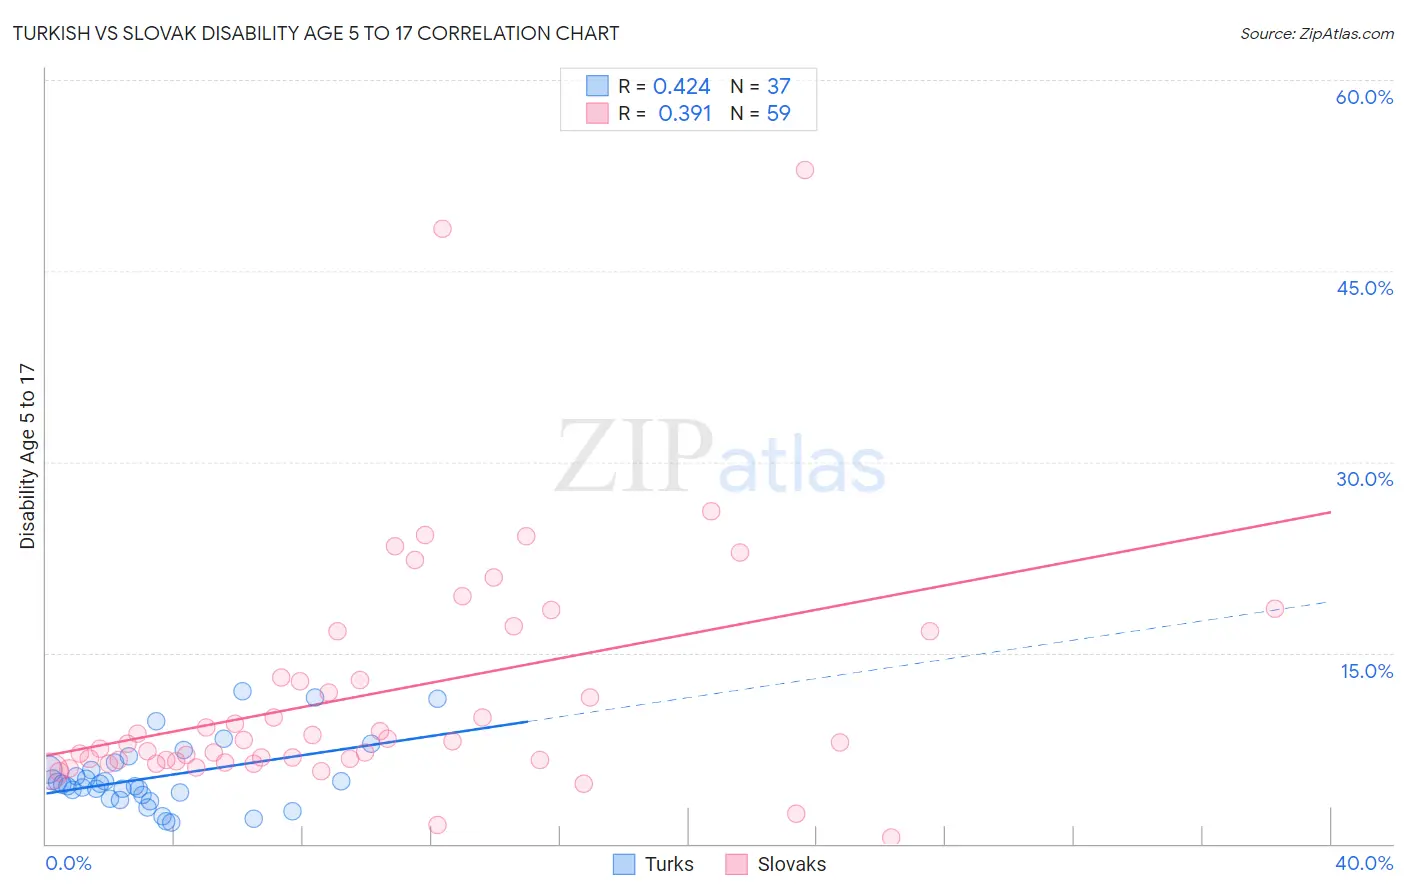
Turkish vs Slovak Disability Age 5 to 17 Correlation Chart
The statistical analysis conducted on geographies consisting of 270,239,204 people shows a moderate positive correlation between the proportion of Turks and percentage of population with a disability between the ages 5 and 17 in the United States with a correlation coefficient (R) of 0.424 and weighted average of 5.1%. Similarly, the statistical analysis conducted on geographies consisting of 393,379,089 people shows a mild positive correlation between the proportion of Slovaks and percentage of population with a disability between the ages 5 and 17 in the United States with a correlation coefficient (R) of 0.391 and weighted average of 6.5%, a difference of 27.7%.
Disability Age 5 to 17 Correlation Summary
| Measurement | Turkish | Slovak |
| Minimum | 1.7% | 0.44% |
| Maximum | 12.0% | 52.9% |
| Range | 10.3% | 52.5% |
| Mean | 5.3% | 11.8% |
| Median | 4.7% | 8.1% |
| Interquartile 25% (IQ1) | 3.7% | 6.5% |
| Interquartile 75% (IQ3) | 6.1% | 16.7% |
| Interquartile Range (IQR) | 2.4% | 10.1% |
| Standard Deviation (Sample) | 2.6% | 9.6% |
| Standard Deviation (Population) | 2.6% | 9.5% |
Similar Demographics by Disability Age 5 to 17
Demographics Similar to Turks by Disability Age 5 to 17
In terms of disability age 5 to 17, the demographic groups most similar to Turks are Immigrants from Fiji (5.1%, a difference of 0.090%), Immigrants from Lithuania (5.1%, a difference of 0.14%), Paraguayan (5.1%, a difference of 0.17%), Laotian (5.1%, a difference of 0.22%), and Immigrants from Turkey (5.1%, a difference of 0.23%).
| Demographics | Rating | Rank | Disability Age 5 to 17 |
| Egyptians | 100.0 /100 | #44 | Exceptional 5.0% |
| Tongans | 100.0 /100 | #45 | Exceptional 5.0% |
| Assyrians/Chaldeans/Syriacs | 100.0 /100 | #46 | Exceptional 5.0% |
| Vietnamese | 100.0 /100 | #47 | Exceptional 5.1% |
| Koreans | 100.0 /100 | #48 | Exceptional 5.1% |
| Immigrants | Western Asia | 100.0 /100 | #49 | Exceptional 5.1% |
| Argentineans | 99.9 /100 | #50 | Exceptional 5.1% |
| Turks | 99.9 /100 | #51 | Exceptional 5.1% |
| Immigrants | Fiji | 99.9 /100 | #52 | Exceptional 5.1% |
| Immigrants | Lithuania | 99.9 /100 | #53 | Exceptional 5.1% |
| Paraguayans | 99.9 /100 | #54 | Exceptional 5.1% |
| Laotians | 99.9 /100 | #55 | Exceptional 5.1% |
| Immigrants | Turkey | 99.9 /100 | #56 | Exceptional 5.1% |
| Immigrants | Poland | 99.9 /100 | #57 | Exceptional 5.1% |
| Immigrants | Ukraine | 99.9 /100 | #58 | Exceptional 5.1% |
Demographics Similar to Slovaks by Disability Age 5 to 17
In terms of disability age 5 to 17, the demographic groups most similar to Slovaks are Tohono O'odham (6.5%, a difference of 0.020%), Osage (6.5%, a difference of 0.040%), Dominican (6.5%, a difference of 0.12%), American (6.5%, a difference of 0.17%), and Potawatomi (6.5%, a difference of 0.31%).
| Demographics | Rating | Rank | Disability Age 5 to 17 |
| Immigrants | Portugal | 0.0 /100 | #315 | Tragic 6.4% |
| Immigrants | Dominican Republic | 0.0 /100 | #316 | Tragic 6.4% |
| Kiowa | 0.0 /100 | #317 | Tragic 6.4% |
| Comanche | 0.0 /100 | #318 | Tragic 6.4% |
| Delaware | 0.0 /100 | #319 | Tragic 6.5% |
| Africans | 0.0 /100 | #320 | Tragic 6.5% |
| Tohono O'odham | 0.0 /100 | #321 | Tragic 6.5% |
| Slovaks | 0.0 /100 | #322 | Tragic 6.5% |
| Osage | 0.0 /100 | #323 | Tragic 6.5% |
| Dominicans | 0.0 /100 | #324 | Tragic 6.5% |
| Americans | 0.0 /100 | #325 | Tragic 6.5% |
| Potawatomi | 0.0 /100 | #326 | Tragic 6.5% |
| French American Indians | 0.0 /100 | #327 | Tragic 6.6% |
| Pennsylvania Germans | 0.0 /100 | #328 | Tragic 6.6% |
| Blackfeet | 0.0 /100 | #329 | Tragic 6.6% |