Turkish vs Barbadian 4 or more Vehicles in Household
COMPARE
Turkish
Barbadian
4 or more Vehicles in Household
4 or more Vehicles in Household Comparison
Turks
Barbadians
5.8%
4 OR MORE VEHICLES IN HOUSEHOLD
4.1/ 100
METRIC RATING
237th/ 347
METRIC RANK
3.9%
4 OR MORE VEHICLES IN HOUSEHOLD
0.0/ 100
METRIC RATING
335th/ 347
METRIC RANK
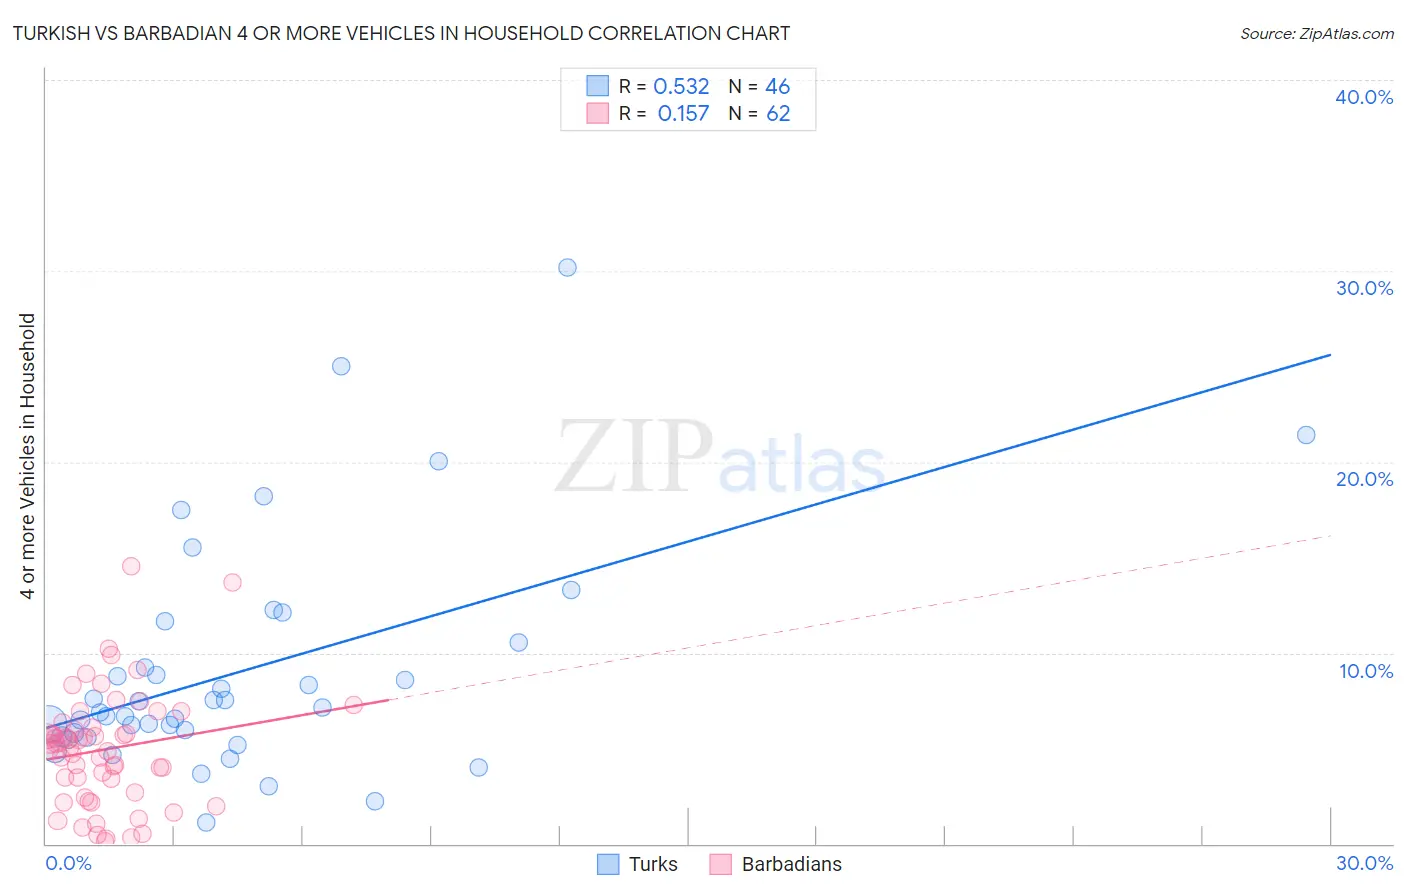
Turkish vs Barbadian 4 or more Vehicles in Household Correlation Chart
The statistical analysis conducted on geographies consisting of 270,554,311 people shows a substantial positive correlation between the proportion of Turks and percentage of households with 4 or more vehicles available in the United States with a correlation coefficient (R) of 0.532 and weighted average of 5.8%. Similarly, the statistical analysis conducted on geographies consisting of 140,490,439 people shows a poor positive correlation between the proportion of Barbadians and percentage of households with 4 or more vehicles available in the United States with a correlation coefficient (R) of 0.157 and weighted average of 3.9%, a difference of 49.1%.
4 or more Vehicles in Household Correlation Summary
| Measurement | Turkish | Barbadian |
| Minimum | 1.1% | 0.11% |
| Maximum | 30.2% | 14.6% |
| Range | 29.1% | 14.5% |
| Mean | 9.1% | 4.9% |
| Median | 7.0% | 5.1% |
| Interquartile 25% (IQ1) | 5.6% | 2.7% |
| Interquartile 75% (IQ3) | 10.5% | 6.1% |
| Interquartile Range (IQR) | 4.9% | 3.4% |
| Standard Deviation (Sample) | 6.0% | 3.0% |
| Standard Deviation (Population) | 5.9% | 3.0% |
Similar Demographics by 4 or more Vehicles in Household
Demographics Similar to Turks by 4 or more Vehicles in Household
In terms of 4 or more vehicles in household, the demographic groups most similar to Turks are Immigrants from Belgium (5.8%, a difference of 0.13%), Immigrants from Australia (5.8%, a difference of 0.22%), Immigrants from Poland (5.8%, a difference of 0.26%), Immigrants from Eritrea (5.8%, a difference of 0.27%), and Immigrants from Hungary (5.8%, a difference of 0.29%).
| Demographics | Rating | Rank | 4 or more Vehicles in Household |
| Immigrants | Malaysia | 6.7 /100 | #230 | Tragic 5.9% |
| Immigrants | Switzerland | 6.4 /100 | #231 | Tragic 5.9% |
| Immigrants | Argentina | 6.0 /100 | #232 | Tragic 5.9% |
| Sierra Leoneans | 6.0 /100 | #233 | Tragic 5.9% |
| Africans | 4.6 /100 | #234 | Tragic 5.8% |
| Immigrants | Hungary | 4.6 /100 | #235 | Tragic 5.8% |
| Immigrants | Eritrea | 4.5 /100 | #236 | Tragic 5.8% |
| Turks | 4.1 /100 | #237 | Tragic 5.8% |
| Immigrants | Belgium | 4.0 /100 | #238 | Tragic 5.8% |
| Immigrants | Australia | 3.8 /100 | #239 | Tragic 5.8% |
| Immigrants | Poland | 3.8 /100 | #240 | Tragic 5.8% |
| Mongolians | 3.7 /100 | #241 | Tragic 5.8% |
| Immigrants | Middle Africa | 3.4 /100 | #242 | Tragic 5.8% |
| Immigrants | Czechoslovakia | 3.2 /100 | #243 | Tragic 5.8% |
| Ethiopians | 3.2 /100 | #244 | Tragic 5.8% |
Demographics Similar to Barbadians by 4 or more Vehicles in Household
In terms of 4 or more vehicles in household, the demographic groups most similar to Barbadians are Immigrants from Bangladesh (3.9%, a difference of 0.18%), Vietnamese (3.9%, a difference of 0.69%), Immigrants from Cabo Verde (3.8%, a difference of 2.5%), Immigrants from Trinidad and Tobago (4.1%, a difference of 5.2%), and Immigrants from Albania (4.1%, a difference of 5.4%).
| Demographics | Rating | Rank | 4 or more Vehicles in Household |
| Trinidadians and Tobagonians | 0.0 /100 | #328 | Tragic 4.3% |
| Immigrants | Senegal | 0.0 /100 | #329 | Tragic 4.2% |
| Immigrants | Ecuador | 0.0 /100 | #330 | Tragic 4.2% |
| West Indians | 0.0 /100 | #331 | Tragic 4.2% |
| Immigrants | Dominica | 0.0 /100 | #332 | Tragic 4.2% |
| Immigrants | Albania | 0.0 /100 | #333 | Tragic 4.1% |
| Immigrants | Trinidad and Tobago | 0.0 /100 | #334 | Tragic 4.1% |
| Barbadians | 0.0 /100 | #335 | Tragic 3.9% |
| Immigrants | Bangladesh | 0.0 /100 | #336 | Tragic 3.9% |
| Vietnamese | 0.0 /100 | #337 | Tragic 3.9% |
| Immigrants | Cabo Verde | 0.0 /100 | #338 | Tragic 3.8% |
| Immigrants | Uzbekistan | 0.0 /100 | #339 | Tragic 3.6% |
| Immigrants | Barbados | 0.0 /100 | #340 | Tragic 3.6% |
| Dominicans | 0.0 /100 | #341 | Tragic 3.5% |
| Guyanese | 0.0 /100 | #342 | Tragic 3.5% |