Costa Rican vs Somali Disability Age Over 75
COMPARE
Costa Rican
Somali
Disability Age Over 75
Disability Age Over 75 Comparison
Costa Ricans
Somalis
46.9%
DISABILITY AGE OVER 75
84.5/ 100
METRIC RATING
145th/ 347
METRIC RANK
47.6%
DISABILITY AGE OVER 75
29.5/ 100
METRIC RATING
190th/ 347
METRIC RANK
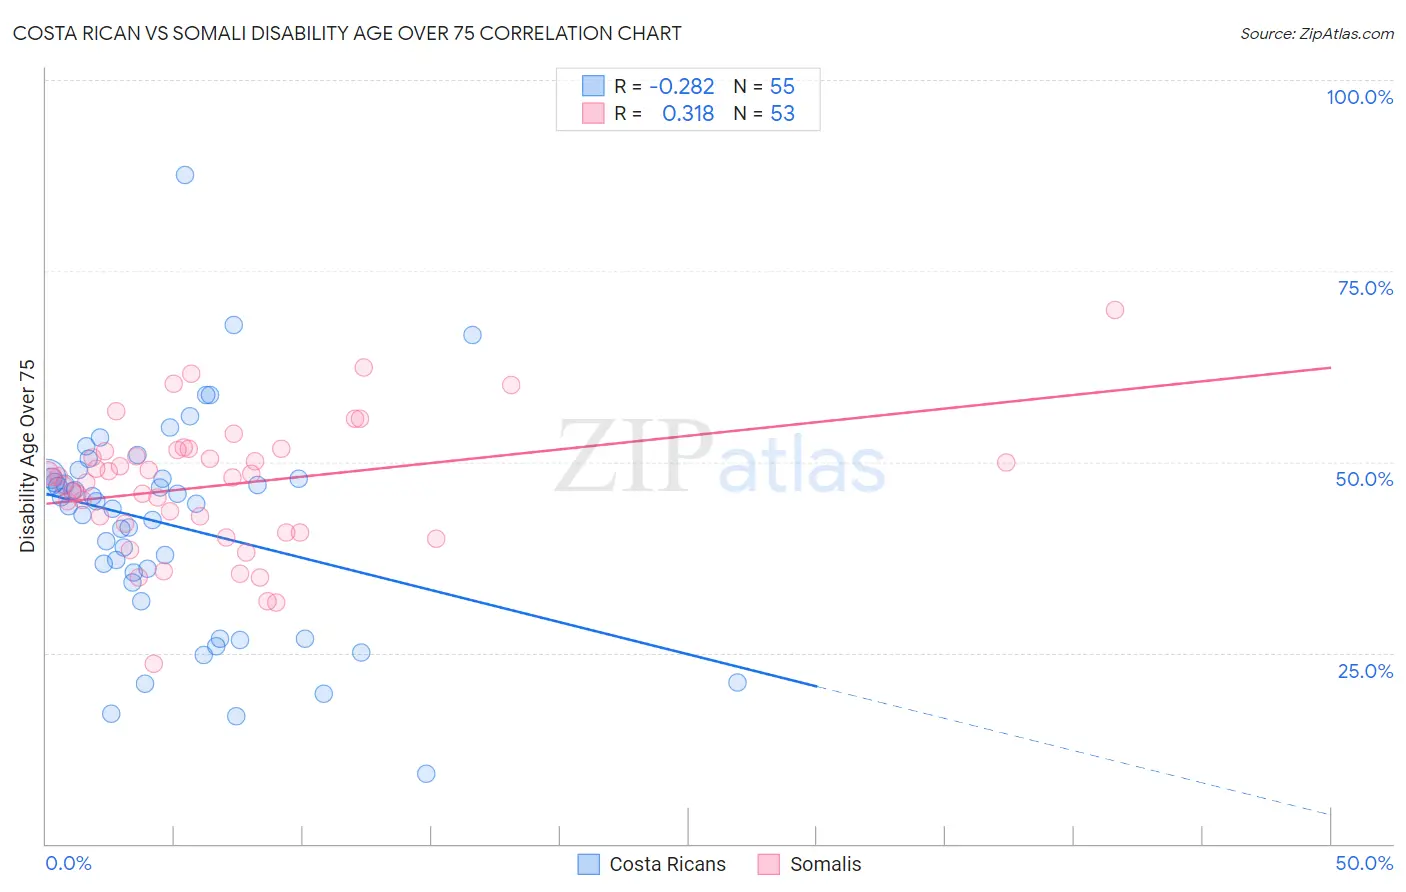
Costa Rican vs Somali Disability Age Over 75 Correlation Chart
The statistical analysis conducted on geographies consisting of 253,327,132 people shows a weak negative correlation between the proportion of Costa Ricans and percentage of population with a disability over the age of 75 in the United States with a correlation coefficient (R) of -0.282 and weighted average of 46.9%. Similarly, the statistical analysis conducted on geographies consisting of 99,187,417 people shows a mild positive correlation between the proportion of Somalis and percentage of population with a disability over the age of 75 in the United States with a correlation coefficient (R) of 0.318 and weighted average of 47.6%, a difference of 1.5%.
Disability Age Over 75 Correlation Summary
| Measurement | Costa Rican | Somali |
| Minimum | 9.1% | 23.5% |
| Maximum | 87.5% | 69.9% |
| Range | 78.4% | 46.4% |
| Mean | 41.7% | 46.9% |
| Median | 44.5% | 48.0% |
| Interquartile 25% (IQ1) | 34.2% | 41.4% |
| Interquartile 75% (IQ3) | 47.9% | 51.5% |
| Interquartile Range (IQR) | 13.6% | 10.1% |
| Standard Deviation (Sample) | 14.0% | 8.5% |
| Standard Deviation (Population) | 13.9% | 8.5% |
Similar Demographics by Disability Age Over 75
Demographics Similar to Costa Ricans by Disability Age Over 75
In terms of disability age over 75, the demographic groups most similar to Costa Ricans are Guyanese (46.9%, a difference of 0.010%), Venezuelan (46.9%, a difference of 0.020%), Immigrants from Peru (46.9%, a difference of 0.020%), Bermudan (46.9%, a difference of 0.050%), and Peruvian (46.8%, a difference of 0.090%).
| Demographics | Rating | Rank | Disability Age Over 75 |
| Immigrants | Bosnia and Herzegovina | 88.5 /100 | #138 | Excellent 46.8% |
| Yugoslavians | 88.5 /100 | #139 | Excellent 46.8% |
| Immigrants | Costa Rica | 87.4 /100 | #140 | Excellent 46.8% |
| Lebanese | 87.0 /100 | #141 | Excellent 46.8% |
| Peruvians | 86.5 /100 | #142 | Excellent 46.8% |
| Bermudans | 85.6 /100 | #143 | Excellent 46.9% |
| Venezuelans | 85.0 /100 | #144 | Excellent 46.9% |
| Costa Ricans | 84.5 /100 | #145 | Excellent 46.9% |
| Guyanese | 84.3 /100 | #146 | Excellent 46.9% |
| Immigrants | Peru | 84.1 /100 | #147 | Excellent 46.9% |
| Asians | 81.6 /100 | #148 | Excellent 46.9% |
| Welsh | 81.3 /100 | #149 | Excellent 47.0% |
| Immigrants | Russia | 79.3 /100 | #150 | Good 47.0% |
| French Canadians | 79.0 /100 | #151 | Good 47.0% |
| Immigrants | Asia | 76.5 /100 | #152 | Good 47.0% |
Demographics Similar to Somalis by Disability Age Over 75
In terms of disability age over 75, the demographic groups most similar to Somalis are Portuguese (47.6%, a difference of 0.010%), Immigrants from Jamaica (47.6%, a difference of 0.030%), Basque (47.6%, a difference of 0.040%), Immigrants from Kenya (47.6%, a difference of 0.040%), and Ottawa (47.6%, a difference of 0.040%).
| Demographics | Rating | Rank | Disability Age Over 75 |
| Delaware | 39.1 /100 | #183 | Fair 47.5% |
| Immigrants | Nigeria | 34.0 /100 | #184 | Fair 47.5% |
| Ghanaians | 33.0 /100 | #185 | Fair 47.5% |
| Sudanese | 32.0 /100 | #186 | Fair 47.5% |
| Immigrants | Sudan | 31.8 /100 | #187 | Fair 47.5% |
| Basques | 30.9 /100 | #188 | Fair 47.6% |
| Immigrants | Kenya | 30.8 /100 | #189 | Fair 47.6% |
| Somalis | 29.5 /100 | #190 | Fair 47.6% |
| Portuguese | 29.3 /100 | #191 | Fair 47.6% |
| Immigrants | Jamaica | 28.3 /100 | #192 | Fair 47.6% |
| Ottawa | 28.1 /100 | #193 | Fair 47.6% |
| Immigrants | Lebanon | 26.5 /100 | #194 | Fair 47.6% |
| Immigrants | Trinidad and Tobago | 25.3 /100 | #195 | Fair 47.6% |
| Immigrants | Portugal | 23.8 /100 | #196 | Fair 47.6% |
| Pakistanis | 23.4 /100 | #197 | Fair 47.7% |