Immigrants from Oceania vs Slovak Disability Age Over 75
COMPARE
Immigrants from Oceania
Slovak
Disability Age Over 75
Disability Age Over 75 Comparison
Immigrants from Oceania
Slovaks
48.0%
DISABILITY AGE OVER 75
7.3/ 100
METRIC RATING
221st/ 347
METRIC RANK
45.8%
DISABILITY AGE OVER 75
99.6/ 100
METRIC RATING
54th/ 347
METRIC RANK
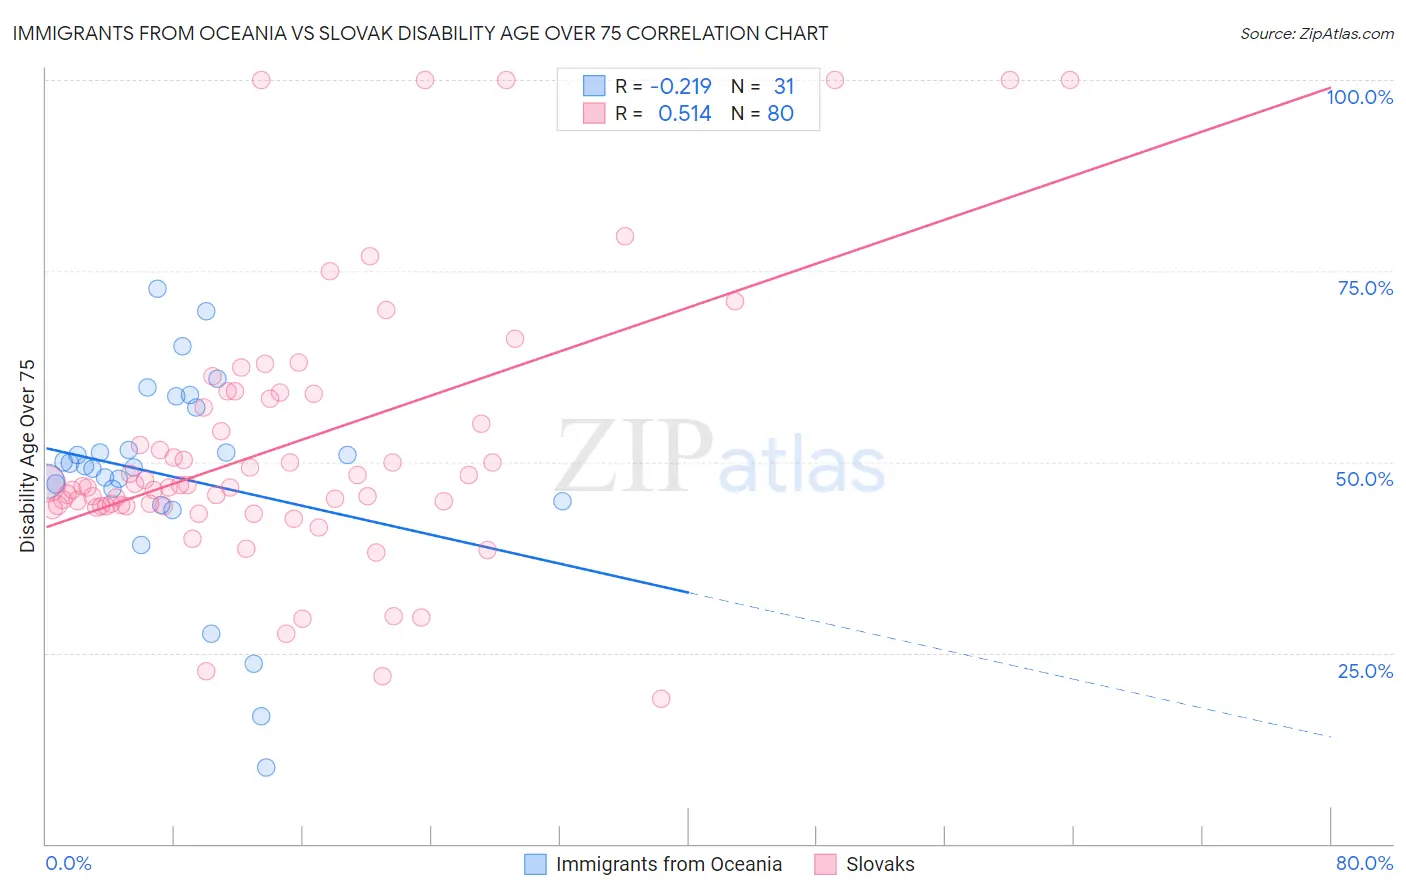
Immigrants from Oceania vs Slovak Disability Age Over 75 Correlation Chart
The statistical analysis conducted on geographies consisting of 304,867,305 people shows a weak negative correlation between the proportion of Immigrants from Oceania and percentage of population with a disability over the age of 75 in the United States with a correlation coefficient (R) of -0.219 and weighted average of 48.0%. Similarly, the statistical analysis conducted on geographies consisting of 397,228,440 people shows a substantial positive correlation between the proportion of Slovaks and percentage of population with a disability over the age of 75 in the United States with a correlation coefficient (R) of 0.514 and weighted average of 45.8%, a difference of 4.7%.
Disability Age Over 75 Correlation Summary
| Measurement | Immigrants from Oceania | Slovak |
| Minimum | 10.0% | 19.0% |
| Maximum | 72.7% | 100.0% |
| Range | 62.7% | 81.0% |
| Mean | 48.2% | 52.1% |
| Median | 49.5% | 46.9% |
| Interquartile 25% (IQ1) | 44.8% | 44.2% |
| Interquartile 75% (IQ3) | 57.1% | 58.6% |
| Interquartile Range (IQR) | 12.3% | 14.4% |
| Standard Deviation (Sample) | 13.7% | 17.7% |
| Standard Deviation (Population) | 13.5% | 17.6% |
Similar Demographics by Disability Age Over 75
Demographics Similar to Immigrants from Oceania by Disability Age Over 75
In terms of disability age over 75, the demographic groups most similar to Immigrants from Oceania are Immigrants from Western Asia (48.0%, a difference of 0.010%), Bahamian (48.0%, a difference of 0.010%), Barbadian (48.0%, a difference of 0.040%), Immigrants from Bangladesh (48.0%, a difference of 0.050%), and Liberian (48.0%, a difference of 0.060%).
| Demographics | Rating | Rank | Disability Age Over 75 |
| Immigrants | Barbados | 10.7 /100 | #214 | Poor 47.9% |
| Senegalese | 10.7 /100 | #215 | Poor 47.9% |
| Immigrants | Panama | 10.2 /100 | #216 | Poor 47.9% |
| Immigrants | Grenada | 9.4 /100 | #217 | Tragic 47.9% |
| Immigrants | Western Africa | 8.3 /100 | #218 | Tragic 48.0% |
| Immigrants | Western Asia | 7.5 /100 | #219 | Tragic 48.0% |
| Bahamians | 7.4 /100 | #220 | Tragic 48.0% |
| Immigrants | Oceania | 7.3 /100 | #221 | Tragic 48.0% |
| Barbadians | 6.8 /100 | #222 | Tragic 48.0% |
| Immigrants | Bangladesh | 6.8 /100 | #223 | Tragic 48.0% |
| Liberians | 6.7 /100 | #224 | Tragic 48.0% |
| Spanish | 6.5 /100 | #225 | Tragic 48.0% |
| Immigrants | Nonimmigrants | 6.5 /100 | #226 | Tragic 48.0% |
| Zimbabweans | 6.4 /100 | #227 | Tragic 48.1% |
| Immigrants | Liberia | 5.9 /100 | #228 | Tragic 48.1% |
Demographics Similar to Slovaks by Disability Age Over 75
In terms of disability age over 75, the demographic groups most similar to Slovaks are Maltese (45.8%, a difference of 0.0%), Immigrants from Netherlands (45.9%, a difference of 0.070%), Immigrants from Italy (45.8%, a difference of 0.080%), Immigrants from Turkey (45.9%, a difference of 0.080%), and Immigrants from France (45.8%, a difference of 0.090%).
| Demographics | Rating | Rank | Disability Age Over 75 |
| Immigrants | Canada | 99.8 /100 | #47 | Exceptional 45.7% |
| Croatians | 99.8 /100 | #48 | Exceptional 45.7% |
| Immigrants | North America | 99.8 /100 | #49 | Exceptional 45.7% |
| Belgians | 99.7 /100 | #50 | Exceptional 45.8% |
| Immigrants | Korea | 99.7 /100 | #51 | Exceptional 45.8% |
| Immigrants | France | 99.7 /100 | #52 | Exceptional 45.8% |
| Immigrants | Italy | 99.7 /100 | #53 | Exceptional 45.8% |
| Slovaks | 99.6 /100 | #54 | Exceptional 45.8% |
| Maltese | 99.6 /100 | #55 | Exceptional 45.8% |
| Immigrants | Netherlands | 99.6 /100 | #56 | Exceptional 45.9% |
| Immigrants | Turkey | 99.6 /100 | #57 | Exceptional 45.9% |
| Immigrants | Israel | 99.6 /100 | #58 | Exceptional 45.9% |
| Iranians | 99.6 /100 | #59 | Exceptional 45.9% |
| Immigrants | Europe | 99.6 /100 | #60 | Exceptional 45.9% |
| Immigrants | Argentina | 99.6 /100 | #61 | Exceptional 45.9% |