Tlingit-Haida vs Shoshone Single Father Poverty
COMPARE
Tlingit-Haida
Shoshone
Single Father Poverty
Single Father Poverty Comparison
Tlingit-Haida
Shoshone
15.3%
SINGLE FATHER POVERTY
99.5/ 100
METRIC RATING
78th/ 347
METRIC RANK
22.9%
SINGLE FATHER POVERTY
0.0/ 100
METRIC RATING
335th/ 347
METRIC RANK
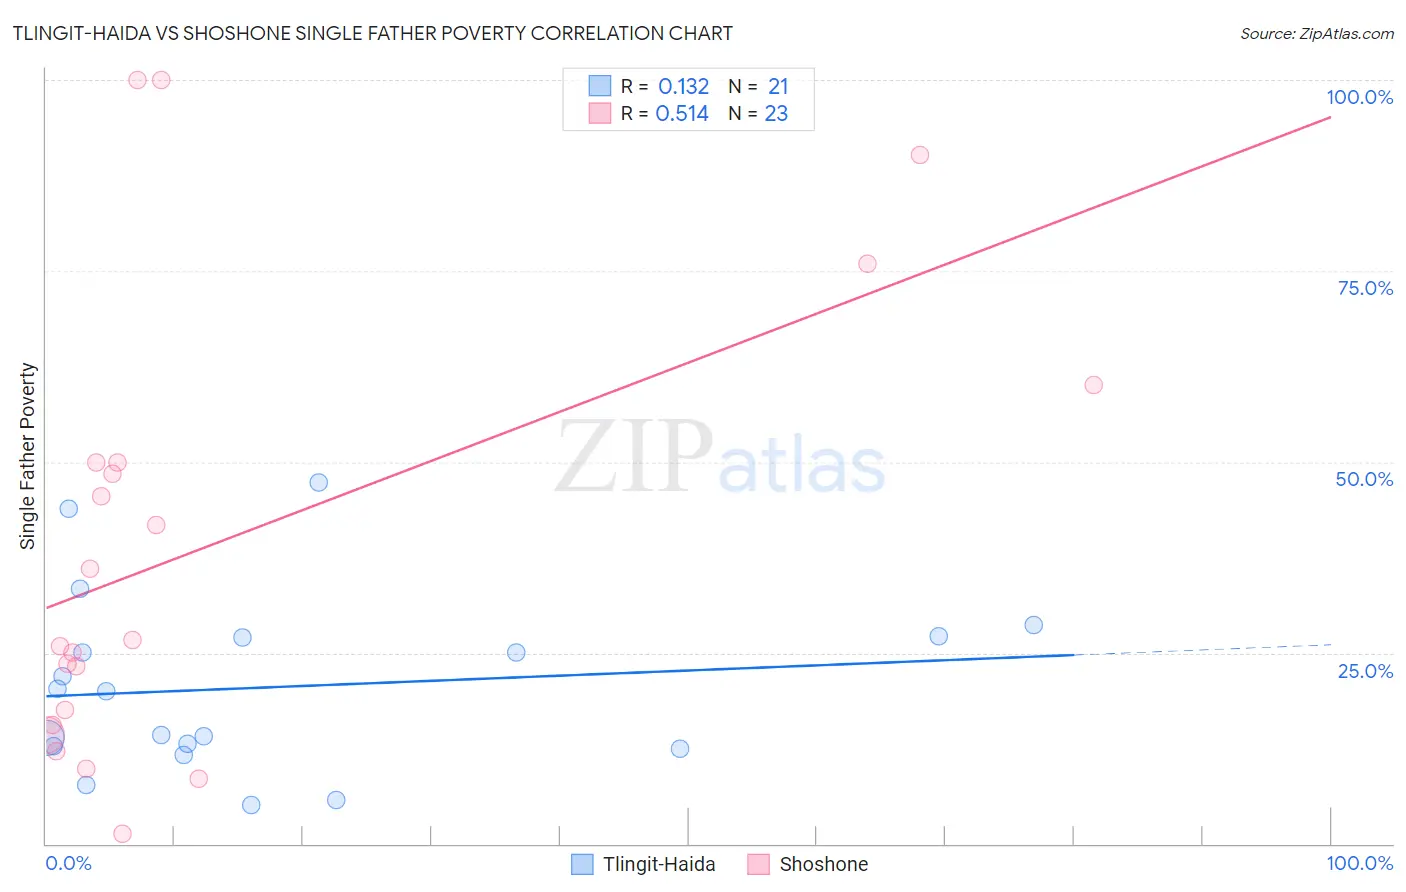
Tlingit-Haida vs Shoshone Single Father Poverty Correlation Chart
The statistical analysis conducted on geographies consisting of 55,978,156 people shows a poor positive correlation between the proportion of Tlingit-Haida and poverty level among single fathers in the United States with a correlation coefficient (R) of 0.132 and weighted average of 15.3%. Similarly, the statistical analysis conducted on geographies consisting of 62,234,172 people shows a substantial positive correlation between the proportion of Shoshone and poverty level among single fathers in the United States with a correlation coefficient (R) of 0.514 and weighted average of 22.9%, a difference of 49.3%.
Single Father Poverty Correlation Summary
| Measurement | Tlingit-Haida | Shoshone |
| Minimum | 5.1% | 1.4% |
| Maximum | 47.4% | 100.0% |
| Range | 42.2% | 98.6% |
| Mean | 20.5% | 39.2% |
| Median | 20.0% | 26.6% |
| Interquartile 25% (IQ1) | 12.6% | 15.5% |
| Interquartile 75% (IQ3) | 27.1% | 50.0% |
| Interquartile Range (IQR) | 14.4% | 34.5% |
| Standard Deviation (Sample) | 11.5% | 29.3% |
| Standard Deviation (Population) | 11.2% | 28.6% |
Similar Demographics by Single Father Poverty
Demographics Similar to Tlingit-Haida by Single Father Poverty
In terms of single father poverty, the demographic groups most similar to Tlingit-Haida are Immigrants from Northern Africa (15.3%, a difference of 0.020%), Immigrants from Peru (15.3%, a difference of 0.050%), Immigrants from Japan (15.3%, a difference of 0.060%), Immigrants from Turkey (15.3%, a difference of 0.14%), and Maltese (15.3%, a difference of 0.16%).
| Demographics | Rating | Rank | Single Father Poverty |
| Immigrants | Brazil | 99.6 /100 | #71 | Exceptional 15.3% |
| Immigrants | Lithuania | 99.6 /100 | #72 | Exceptional 15.3% |
| Kenyans | 99.6 /100 | #73 | Exceptional 15.3% |
| Maltese | 99.6 /100 | #74 | Exceptional 15.3% |
| Immigrants | Turkey | 99.5 /100 | #75 | Exceptional 15.3% |
| Immigrants | Japan | 99.5 /100 | #76 | Exceptional 15.3% |
| Immigrants | Peru | 99.5 /100 | #77 | Exceptional 15.3% |
| Tlingit-Haida | 99.5 /100 | #78 | Exceptional 15.3% |
| Immigrants | Northern Africa | 99.5 /100 | #79 | Exceptional 15.3% |
| Armenians | 99.4 /100 | #80 | Exceptional 15.4% |
| Immigrants | Congo | 99.4 /100 | #81 | Exceptional 15.4% |
| Immigrants | Ukraine | 99.4 /100 | #82 | Exceptional 15.4% |
| Chinese | 99.3 /100 | #83 | Exceptional 15.4% |
| Peruvians | 99.2 /100 | #84 | Exceptional 15.4% |
| Immigrants | Oceania | 99.1 /100 | #85 | Exceptional 15.4% |
Demographics Similar to Shoshone by Single Father Poverty
In terms of single father poverty, the demographic groups most similar to Shoshone are Cajun (23.1%, a difference of 0.71%), Kiowa (22.5%, a difference of 2.0%), Native/Alaskan (22.4%, a difference of 2.3%), Tohono O'odham (22.0%, a difference of 4.1%), and Sioux (23.9%, a difference of 4.2%).
| Demographics | Rating | Rank | Single Father Poverty |
| Pueblo | 0.0 /100 | #328 | Tragic 21.1% |
| Colville | 0.0 /100 | #329 | Tragic 21.4% |
| Paiute | 0.0 /100 | #330 | Tragic 21.6% |
| Central American Indians | 0.0 /100 | #331 | Tragic 21.7% |
| Tohono O'odham | 0.0 /100 | #332 | Tragic 22.0% |
| Natives/Alaskans | 0.0 /100 | #333 | Tragic 22.4% |
| Kiowa | 0.0 /100 | #334 | Tragic 22.5% |
| Shoshone | 0.0 /100 | #335 | Tragic 22.9% |
| Cajuns | 0.0 /100 | #336 | Tragic 23.1% |
| Sioux | 0.0 /100 | #337 | Tragic 23.9% |
| Arapaho | 0.0 /100 | #338 | Tragic 24.0% |
| Apache | 0.0 /100 | #339 | Tragic 24.2% |
| Houma | 0.0 /100 | #340 | Tragic 26.7% |
| Hopi | 0.0 /100 | #341 | Tragic 27.2% |
| Yuman | 0.0 /100 | #342 | Tragic 28.4% |