Tlingit-Haida vs Latvian Disability Age Under 5
COMPARE
Tlingit-Haida
Latvian
Disability Age Under 5
Disability Age Under 5 Comparison
Tlingit-Haida
Latvians
1.5%
DISABILITY AGE UNDER 5
0.0/ 100
METRIC RATING
286th/ 347
METRIC RANK
1.3%
DISABILITY AGE UNDER 5
7.1/ 100
METRIC RATING
224th/ 347
METRIC RANK
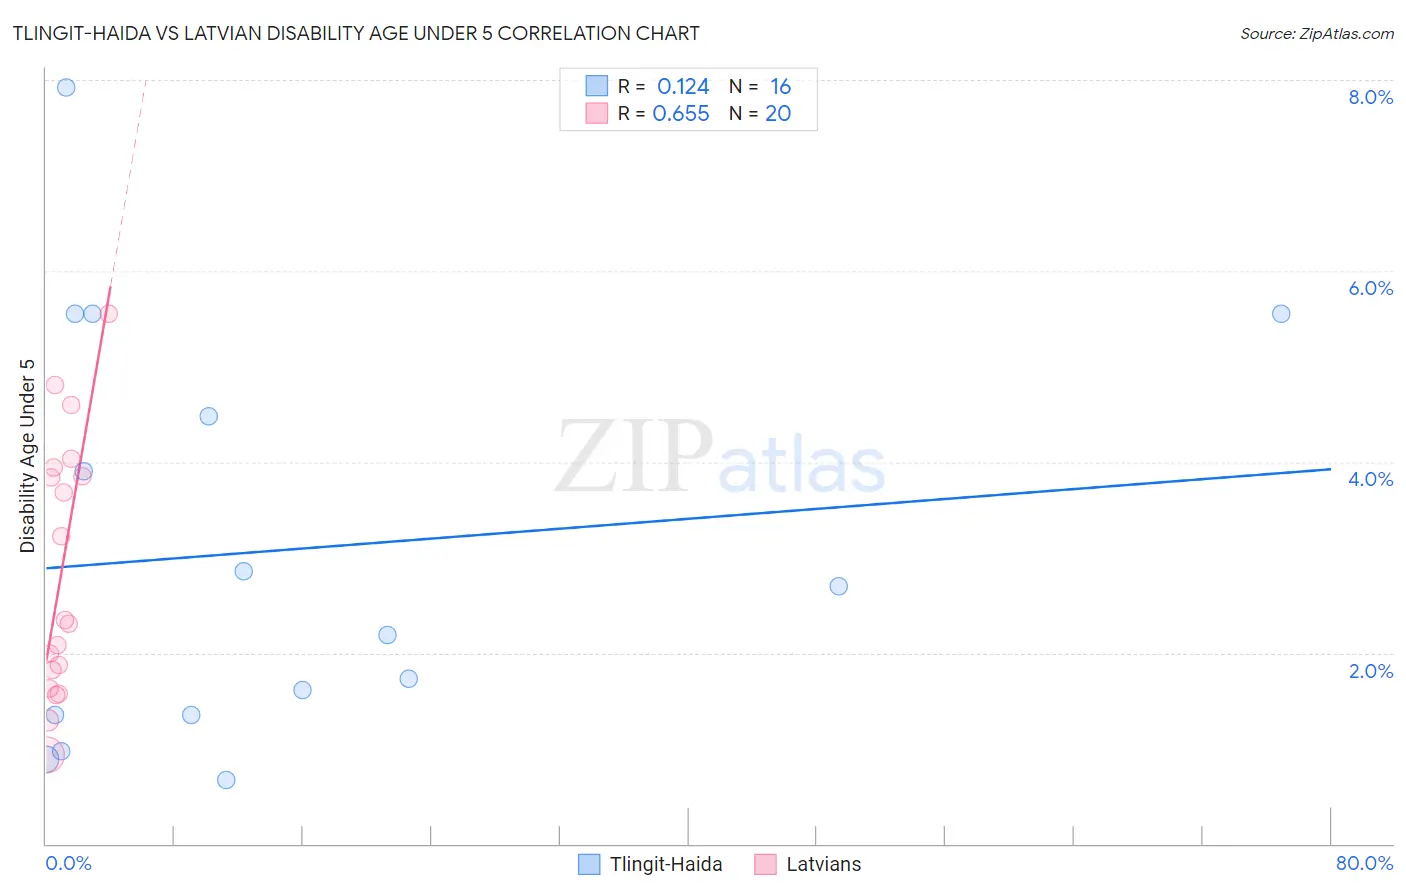
Tlingit-Haida vs Latvian Disability Age Under 5 Correlation Chart
The statistical analysis conducted on geographies consisting of 46,863,169 people shows a poor positive correlation between the proportion of Tlingit-Haida and percentage of population with a disability under the age of 5 in the United States with a correlation coefficient (R) of 0.124 and weighted average of 1.5%. Similarly, the statistical analysis conducted on geographies consisting of 136,122,823 people shows a significant positive correlation between the proportion of Latvians and percentage of population with a disability under the age of 5 in the United States with a correlation coefficient (R) of 0.655 and weighted average of 1.3%, a difference of 17.6%.
Disability Age Under 5 Correlation Summary
| Measurement | Tlingit-Haida | Latvian |
| Minimum | 0.66% | 0.93% |
| Maximum | 7.9% | 5.6% |
| Range | 7.3% | 4.6% |
| Mean | 3.1% | 2.8% |
| Median | 2.4% | 2.3% |
| Interquartile 25% (IQ1) | 1.3% | 1.7% |
| Interquartile 75% (IQ3) | 5.0% | 3.9% |
| Interquartile Range (IQR) | 3.7% | 2.2% |
| Standard Deviation (Sample) | 2.2% | 1.3% |
| Standard Deviation (Population) | 2.1% | 1.3% |
Similar Demographics by Disability Age Under 5
Demographics Similar to Tlingit-Haida by Disability Age Under 5
In terms of disability age under 5, the demographic groups most similar to Tlingit-Haida are Scandinavian (1.5%, a difference of 0.050%), Estonian (1.5%, a difference of 0.23%), Croatian (1.5%, a difference of 0.25%), Hungarian (1.5%, a difference of 0.37%), and Czech (1.5%, a difference of 0.50%).
| Demographics | Rating | Rank | Disability Age Under 5 |
| Danes | 0.0 /100 | #279 | Tragic 1.5% |
| British | 0.0 /100 | #280 | Tragic 1.5% |
| Czechoslovakians | 0.0 /100 | #281 | Tragic 1.5% |
| Cheyenne | 0.0 /100 | #282 | Tragic 1.5% |
| Delaware | 0.0 /100 | #283 | Tragic 1.5% |
| Europeans | 0.0 /100 | #284 | Tragic 1.5% |
| Croatians | 0.0 /100 | #285 | Tragic 1.5% |
| Tlingit-Haida | 0.0 /100 | #286 | Tragic 1.5% |
| Scandinavians | 0.0 /100 | #287 | Tragic 1.5% |
| Estonians | 0.0 /100 | #288 | Tragic 1.5% |
| Hungarians | 0.0 /100 | #289 | Tragic 1.5% |
| Czechs | 0.0 /100 | #290 | Tragic 1.5% |
| Northern Europeans | 0.0 /100 | #291 | Tragic 1.6% |
| Italians | 0.0 /100 | #292 | Tragic 1.6% |
| Lithuanians | 0.0 /100 | #293 | Tragic 1.6% |
Demographics Similar to Latvians by Disability Age Under 5
In terms of disability age under 5, the demographic groups most similar to Latvians are Panamanian (1.3%, a difference of 0.030%), Bahamian (1.3%, a difference of 0.030%), Hispanic or Latino (1.3%, a difference of 0.16%), Subsaharan African (1.3%, a difference of 0.35%), and Ukrainian (1.3%, a difference of 0.35%).
| Demographics | Rating | Rank | Disability Age Under 5 |
| Cypriots | 14.9 /100 | #217 | Poor 1.3% |
| Malaysians | 13.2 /100 | #218 | Poor 1.3% |
| Immigrants | Croatia | 11.2 /100 | #219 | Poor 1.3% |
| Serbians | 9.6 /100 | #220 | Tragic 1.3% |
| Sub-Saharan Africans | 8.3 /100 | #221 | Tragic 1.3% |
| Ukrainians | 8.3 /100 | #222 | Tragic 1.3% |
| Hispanics or Latinos | 7.7 /100 | #223 | Tragic 1.3% |
| Latvians | 7.1 /100 | #224 | Tragic 1.3% |
| Panamanians | 7.1 /100 | #225 | Tragic 1.3% |
| Bahamians | 7.1 /100 | #226 | Tragic 1.3% |
| Taiwanese | 6.1 /100 | #227 | Tragic 1.3% |
| Luxembourgers | 6.1 /100 | #228 | Tragic 1.3% |
| Immigrants | Costa Rica | 5.5 /100 | #229 | Tragic 1.3% |
| Lebanese | 5.3 /100 | #230 | Tragic 1.3% |
| Immigrants | Northern Europe | 4.7 /100 | #231 | Tragic 1.3% |