Tlingit-Haida vs Immigrants from Liberia Disability Age Under 5
COMPARE
Tlingit-Haida
Immigrants from Liberia
Disability Age Under 5
Disability Age Under 5 Comparison
Tlingit-Haida
Immigrants from Liberia
1.5%
DISABILITY AGE UNDER 5
0.0/ 100
METRIC RATING
286th/ 347
METRIC RANK
1.4%
DISABILITY AGE UNDER 5
0.6/ 100
METRIC RATING
255th/ 347
METRIC RANK
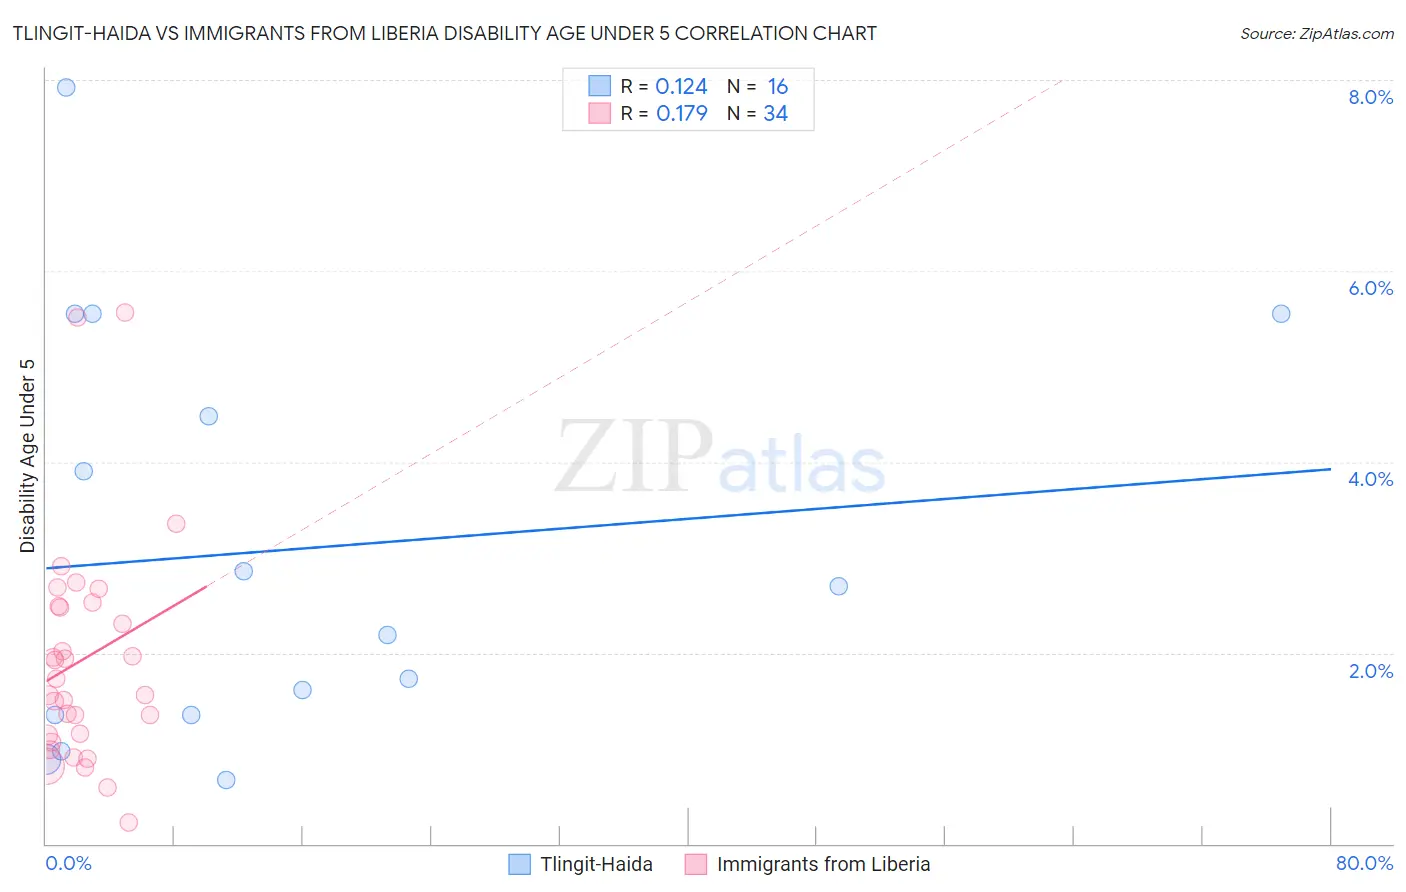
Tlingit-Haida vs Immigrants from Liberia Disability Age Under 5 Correlation Chart
The statistical analysis conducted on geographies consisting of 46,863,169 people shows a poor positive correlation between the proportion of Tlingit-Haida and percentage of population with a disability under the age of 5 in the United States with a correlation coefficient (R) of 0.124 and weighted average of 1.5%. Similarly, the statistical analysis conducted on geographies consisting of 98,567,169 people shows a poor positive correlation between the proportion of Immigrants from Liberia and percentage of population with a disability under the age of 5 in the United States with a correlation coefficient (R) of 0.179 and weighted average of 1.4%, a difference of 11.6%.
Disability Age Under 5 Correlation Summary
| Measurement | Tlingit-Haida | Immigrants from Liberia |
| Minimum | 0.66% | 0.22% |
| Maximum | 7.9% | 5.6% |
| Range | 7.3% | 5.3% |
| Mean | 3.1% | 1.9% |
| Median | 2.4% | 1.6% |
| Interquartile 25% (IQ1) | 1.3% | 1.1% |
| Interquartile 75% (IQ3) | 5.0% | 2.5% |
| Interquartile Range (IQR) | 3.7% | 1.4% |
| Standard Deviation (Sample) | 2.2% | 1.2% |
| Standard Deviation (Population) | 2.1% | 1.2% |
Similar Demographics by Disability Age Under 5
Demographics Similar to Tlingit-Haida by Disability Age Under 5
In terms of disability age under 5, the demographic groups most similar to Tlingit-Haida are Scandinavian (1.5%, a difference of 0.050%), Estonian (1.5%, a difference of 0.23%), Croatian (1.5%, a difference of 0.25%), Hungarian (1.5%, a difference of 0.37%), and Czech (1.5%, a difference of 0.50%).
| Demographics | Rating | Rank | Disability Age Under 5 |
| Danes | 0.0 /100 | #279 | Tragic 1.5% |
| British | 0.0 /100 | #280 | Tragic 1.5% |
| Czechoslovakians | 0.0 /100 | #281 | Tragic 1.5% |
| Cheyenne | 0.0 /100 | #282 | Tragic 1.5% |
| Delaware | 0.0 /100 | #283 | Tragic 1.5% |
| Europeans | 0.0 /100 | #284 | Tragic 1.5% |
| Croatians | 0.0 /100 | #285 | Tragic 1.5% |
| Tlingit-Haida | 0.0 /100 | #286 | Tragic 1.5% |
| Scandinavians | 0.0 /100 | #287 | Tragic 1.5% |
| Estonians | 0.0 /100 | #288 | Tragic 1.5% |
| Hungarians | 0.0 /100 | #289 | Tragic 1.5% |
| Czechs | 0.0 /100 | #290 | Tragic 1.5% |
| Northern Europeans | 0.0 /100 | #291 | Tragic 1.6% |
| Italians | 0.0 /100 | #292 | Tragic 1.6% |
| Lithuanians | 0.0 /100 | #293 | Tragic 1.6% |
Demographics Similar to Immigrants from Liberia by Disability Age Under 5
In terms of disability age under 5, the demographic groups most similar to Immigrants from Liberia are Immigrants from Brazil (1.4%, a difference of 0.060%), Australian (1.4%, a difference of 0.14%), Immigrants from Western Europe (1.4%, a difference of 0.42%), Immigrants from Scotland (1.4%, a difference of 0.81%), and Immigrants from Hungary (1.4%, a difference of 0.86%).
| Demographics | Rating | Rank | Disability Age Under 5 |
| Eastern Europeans | 1.0 /100 | #248 | Tragic 1.4% |
| Bermudans | 1.0 /100 | #249 | Tragic 1.4% |
| Africans | 1.0 /100 | #250 | Tragic 1.4% |
| Immigrants | Hungary | 1.0 /100 | #251 | Tragic 1.4% |
| Immigrants | Scotland | 0.9 /100 | #252 | Tragic 1.4% |
| Australians | 0.7 /100 | #253 | Tragic 1.4% |
| Immigrants | Brazil | 0.7 /100 | #254 | Tragic 1.4% |
| Immigrants | Liberia | 0.6 /100 | #255 | Tragic 1.4% |
| Immigrants | Western Europe | 0.5 /100 | #256 | Tragic 1.4% |
| Slovenes | 0.3 /100 | #257 | Tragic 1.4% |
| Costa Ricans | 0.3 /100 | #258 | Tragic 1.4% |
| Immigrants | Southern Europe | 0.3 /100 | #259 | Tragic 1.4% |
| Slavs | 0.3 /100 | #260 | Tragic 1.4% |
| Immigrants | Netherlands | 0.2 /100 | #261 | Tragic 1.4% |
| Immigrants | Dominica | 0.2 /100 | #262 | Tragic 1.4% |