Tlingit-Haida vs Latvian 8th Grade
COMPARE
Tlingit-Haida
Latvian
8th Grade
8th Grade Comparison
Tlingit-Haida
Latvians
97.3%
8TH GRADE
100.0/ 100
METRIC RATING
16th/ 347
METRIC RANK
97.0%
8TH GRADE
100.0/ 100
METRIC RATING
37th/ 347
METRIC RANK
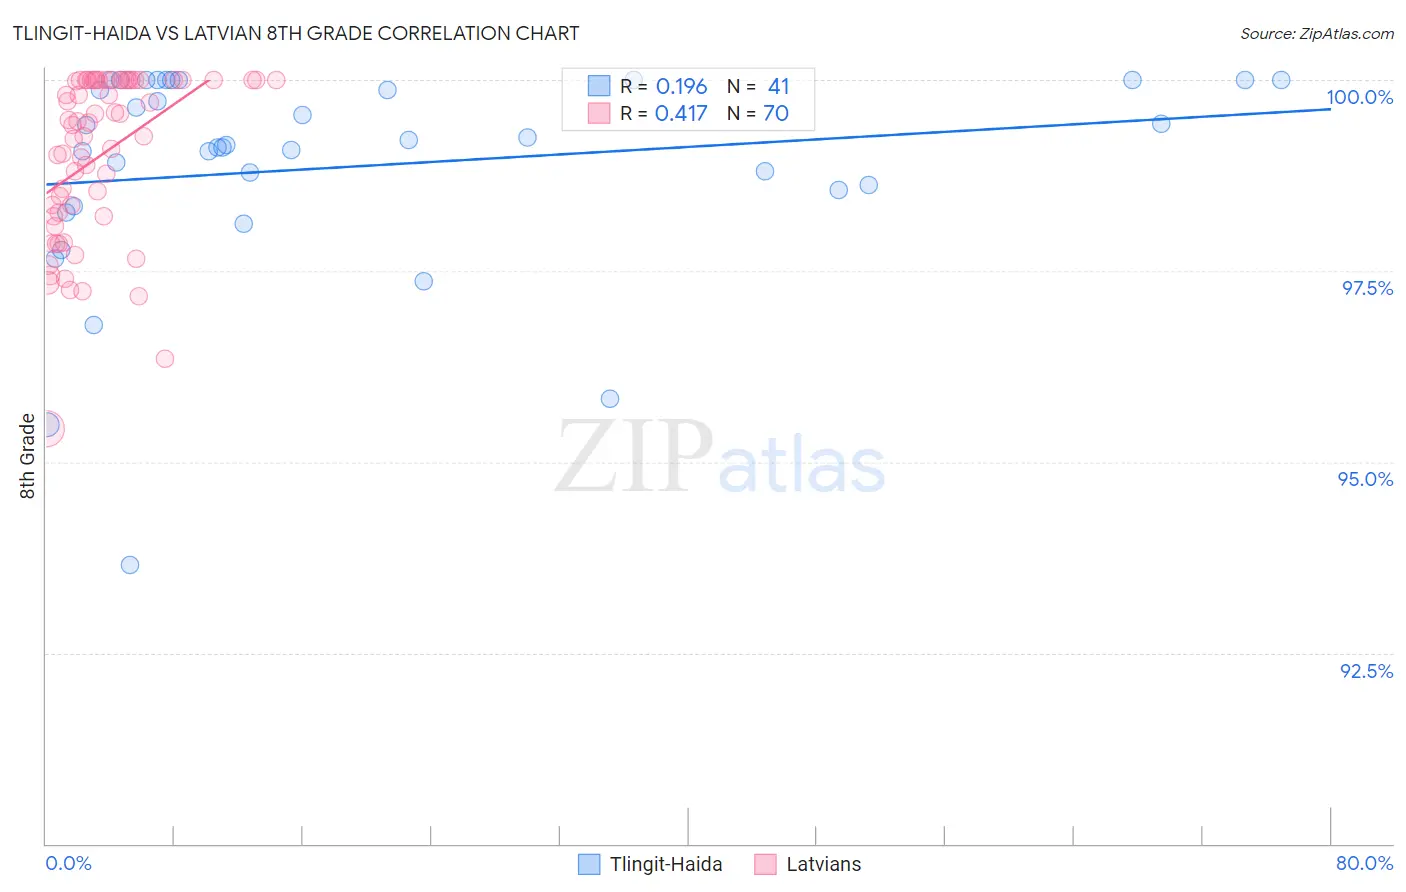
Tlingit-Haida vs Latvian 8th Grade Correlation Chart
The statistical analysis conducted on geographies consisting of 60,865,648 people shows a poor positive correlation between the proportion of Tlingit-Haida and percentage of population with at least 8th grade education in the United States with a correlation coefficient (R) of 0.196 and weighted average of 97.3%. Similarly, the statistical analysis conducted on geographies consisting of 220,726,452 people shows a moderate positive correlation between the proportion of Latvians and percentage of population with at least 8th grade education in the United States with a correlation coefficient (R) of 0.417 and weighted average of 97.0%, a difference of 0.31%.
8th Grade Correlation Summary
| Measurement | Tlingit-Haida | Latvian |
| Minimum | 93.7% | 95.4% |
| Maximum | 100.0% | 100.0% |
| Range | 6.3% | 4.6% |
| Mean | 98.9% | 99.0% |
| Median | 99.1% | 99.4% |
| Interquartile 25% (IQ1) | 98.5% | 98.2% |
| Interquartile 75% (IQ3) | 100.0% | 100.0% |
| Interquartile Range (IQR) | 1.5% | 1.8% |
| Standard Deviation (Sample) | 1.4% | 1.1% |
| Standard Deviation (Population) | 1.4% | 1.1% |
Similar Demographics by 8th Grade
Demographics Similar to Tlingit-Haida by 8th Grade
In terms of 8th grade, the demographic groups most similar to Tlingit-Haida are Irish (97.3%, a difference of 0.010%), Lithuanian (97.3%, a difference of 0.020%), Pennsylvania German (97.3%, a difference of 0.030%), Scottish (97.3%, a difference of 0.030%), and Alaskan Athabascan (97.3%, a difference of 0.040%).
| Demographics | Rating | Rank | 8th Grade |
| Germans | 100.0 /100 | #9 | Exceptional 97.5% |
| Slovenes | 100.0 /100 | #10 | Exceptional 97.5% |
| Poles | 100.0 /100 | #11 | Exceptional 97.4% |
| Swedes | 100.0 /100 | #12 | Exceptional 97.4% |
| Alaskan Athabascans | 100.0 /100 | #13 | Exceptional 97.3% |
| English | 100.0 /100 | #14 | Exceptional 97.3% |
| Pennsylvania Germans | 100.0 /100 | #15 | Exceptional 97.3% |
| Tlingit-Haida | 100.0 /100 | #16 | Exceptional 97.3% |
| Irish | 100.0 /100 | #17 | Exceptional 97.3% |
| Lithuanians | 100.0 /100 | #18 | Exceptional 97.3% |
| Scottish | 100.0 /100 | #19 | Exceptional 97.3% |
| Croatians | 100.0 /100 | #20 | Exceptional 97.2% |
| Danes | 100.0 /100 | #21 | Exceptional 97.2% |
| Welsh | 100.0 /100 | #22 | Exceptional 97.2% |
| French Canadians | 100.0 /100 | #23 | Exceptional 97.2% |
Demographics Similar to Latvians by 8th Grade
In terms of 8th grade, the demographic groups most similar to Latvians are Belgian (97.0%, a difference of 0.0%), Alaska Native (97.0%, a difference of 0.010%), Luxembourger (97.0%, a difference of 0.020%), British (97.0%, a difference of 0.020%), and Hungarian (97.0%, a difference of 0.020%).
| Demographics | Rating | Rank | 8th Grade |
| Sioux | 100.0 /100 | #30 | Exceptional 97.1% |
| Chippewa | 100.0 /100 | #31 | Exceptional 97.1% |
| Yup'ik | 100.0 /100 | #32 | Exceptional 97.0% |
| Swiss | 100.0 /100 | #33 | Exceptional 97.0% |
| Luxembourgers | 100.0 /100 | #34 | Exceptional 97.0% |
| Alaska Natives | 100.0 /100 | #35 | Exceptional 97.0% |
| Belgians | 100.0 /100 | #36 | Exceptional 97.0% |
| Latvians | 100.0 /100 | #37 | Exceptional 97.0% |
| British | 100.0 /100 | #38 | Exceptional 97.0% |
| Hungarians | 100.0 /100 | #39 | Exceptional 97.0% |
| Inupiat | 100.0 /100 | #40 | Exceptional 97.0% |
| Eastern Europeans | 100.0 /100 | #41 | Exceptional 97.0% |
| Chinese | 100.0 /100 | #42 | Exceptional 96.9% |
| Aleuts | 99.9 /100 | #43 | Exceptional 96.9% |
| Maltese | 99.9 /100 | #44 | Exceptional 96.9% |