Immigrants from Caribbean vs Latvian Disability Age Under 5
COMPARE
Immigrants from Caribbean
Latvian
Disability Age Under 5
Disability Age Under 5 Comparison
Immigrants from Caribbean
Latvians
1.2%
DISABILITY AGE UNDER 5
93.8/ 100
METRIC RATING
115th/ 347
METRIC RANK
1.3%
DISABILITY AGE UNDER 5
7.1/ 100
METRIC RATING
224th/ 347
METRIC RANK
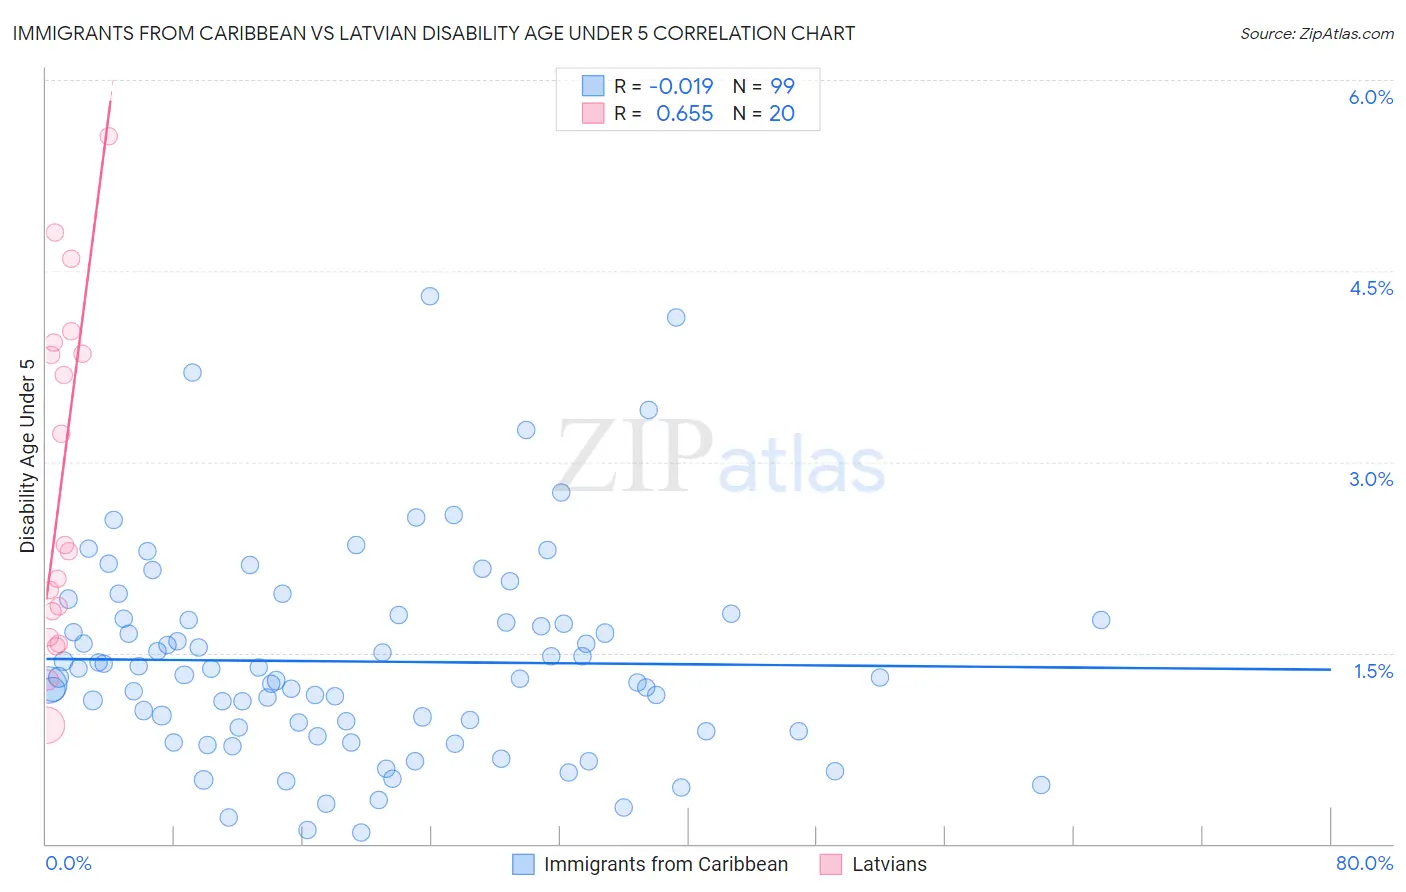
Immigrants from Caribbean vs Latvian Disability Age Under 5 Correlation Chart
The statistical analysis conducted on geographies consisting of 233,002,612 people shows no correlation between the proportion of Immigrants from Caribbean and percentage of population with a disability under the age of 5 in the United States with a correlation coefficient (R) of -0.019 and weighted average of 1.2%. Similarly, the statistical analysis conducted on geographies consisting of 136,122,823 people shows a significant positive correlation between the proportion of Latvians and percentage of population with a disability under the age of 5 in the United States with a correlation coefficient (R) of 0.655 and weighted average of 1.3%, a difference of 12.7%.
Disability Age Under 5 Correlation Summary
| Measurement | Immigrants from Caribbean | Latvian |
| Minimum | 0.090% | 0.93% |
| Maximum | 4.3% | 5.6% |
| Range | 4.2% | 4.6% |
| Mean | 1.4% | 2.8% |
| Median | 1.3% | 2.3% |
| Interquartile 25% (IQ1) | 0.88% | 1.7% |
| Interquartile 75% (IQ3) | 1.8% | 3.9% |
| Interquartile Range (IQR) | 0.88% | 2.2% |
| Standard Deviation (Sample) | 0.81% | 1.3% |
| Standard Deviation (Population) | 0.80% | 1.3% |
Similar Demographics by Disability Age Under 5
Demographics Similar to Immigrants from Caribbean by Disability Age Under 5
In terms of disability age under 5, the demographic groups most similar to Immigrants from Caribbean are Belizean (1.2%, a difference of 0.010%), Immigrants from Northern Africa (1.2%, a difference of 0.020%), Immigrants from Philippines (1.2%, a difference of 0.15%), Immigrants from Oceania (1.2%, a difference of 0.16%), and Immigrants from Venezuela (1.2%, a difference of 0.19%).
| Demographics | Rating | Rank | Disability Age Under 5 |
| Iraqis | 95.1 /100 | #108 | Exceptional 1.2% |
| Immigrants | Panama | 95.0 /100 | #109 | Exceptional 1.2% |
| Immigrants | Lebanon | 95.0 /100 | #110 | Exceptional 1.2% |
| Senegalese | 94.6 /100 | #111 | Exceptional 1.2% |
| Immigrants | Australia | 94.4 /100 | #112 | Exceptional 1.2% |
| Immigrants | Oceania | 94.2 /100 | #113 | Exceptional 1.2% |
| Belizeans | 93.9 /100 | #114 | Exceptional 1.2% |
| Immigrants | Caribbean | 93.8 /100 | #115 | Exceptional 1.2% |
| Immigrants | Northern Africa | 93.8 /100 | #116 | Exceptional 1.2% |
| Immigrants | Philippines | 93.5 /100 | #117 | Exceptional 1.2% |
| Immigrants | Venezuela | 93.4 /100 | #118 | Exceptional 1.2% |
| Bhutanese | 92.5 /100 | #119 | Exceptional 1.2% |
| Immigrants | Eritrea | 92.3 /100 | #120 | Exceptional 1.2% |
| Immigrants | Senegal | 91.4 /100 | #121 | Exceptional 1.2% |
| Aleuts | 90.7 /100 | #122 | Exceptional 1.2% |
Demographics Similar to Latvians by Disability Age Under 5
In terms of disability age under 5, the demographic groups most similar to Latvians are Panamanian (1.3%, a difference of 0.030%), Bahamian (1.3%, a difference of 0.030%), Hispanic or Latino (1.3%, a difference of 0.16%), Subsaharan African (1.3%, a difference of 0.35%), and Ukrainian (1.3%, a difference of 0.35%).
| Demographics | Rating | Rank | Disability Age Under 5 |
| Cypriots | 14.9 /100 | #217 | Poor 1.3% |
| Malaysians | 13.2 /100 | #218 | Poor 1.3% |
| Immigrants | Croatia | 11.2 /100 | #219 | Poor 1.3% |
| Serbians | 9.6 /100 | #220 | Tragic 1.3% |
| Sub-Saharan Africans | 8.3 /100 | #221 | Tragic 1.3% |
| Ukrainians | 8.3 /100 | #222 | Tragic 1.3% |
| Hispanics or Latinos | 7.7 /100 | #223 | Tragic 1.3% |
| Latvians | 7.1 /100 | #224 | Tragic 1.3% |
| Panamanians | 7.1 /100 | #225 | Tragic 1.3% |
| Bahamians | 7.1 /100 | #226 | Tragic 1.3% |
| Taiwanese | 6.1 /100 | #227 | Tragic 1.3% |
| Luxembourgers | 6.1 /100 | #228 | Tragic 1.3% |
| Immigrants | Costa Rica | 5.5 /100 | #229 | Tragic 1.3% |
| Lebanese | 5.3 /100 | #230 | Tragic 1.3% |
| Immigrants | Northern Europe | 4.7 /100 | #231 | Tragic 1.3% |