Immigrants from Bahamas vs Latvian Disability Age Under 5
COMPARE
Immigrants from Bahamas
Latvian
Disability Age Under 5
Disability Age Under 5 Comparison
Immigrants from Bahamas
Latvians
1.2%
DISABILITY AGE UNDER 5
45.2/ 100
METRIC RATING
179th/ 347
METRIC RANK
1.3%
DISABILITY AGE UNDER 5
7.1/ 100
METRIC RATING
224th/ 347
METRIC RANK
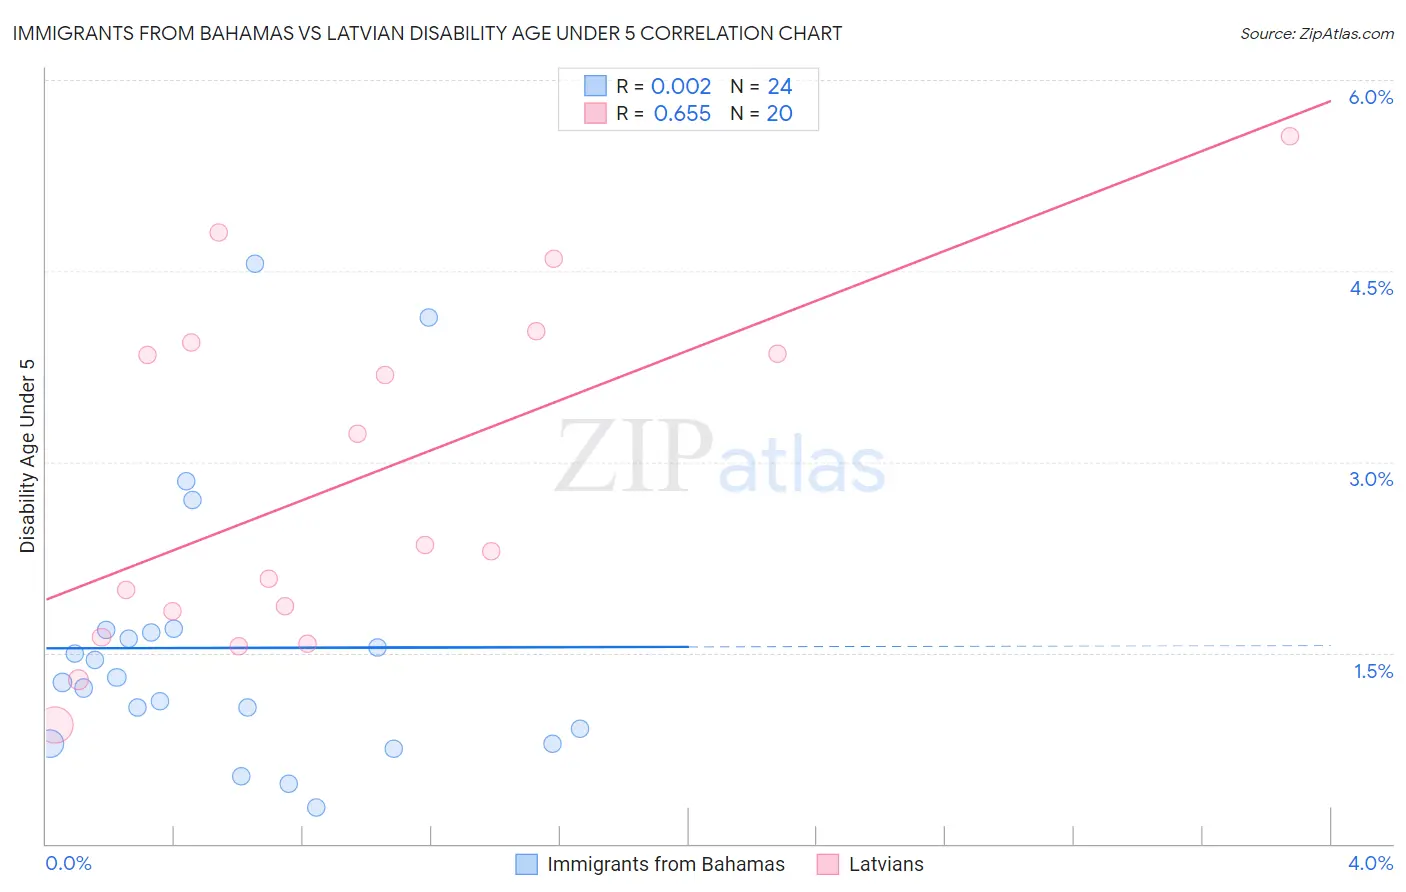
Immigrants from Bahamas vs Latvian Disability Age Under 5 Correlation Chart
The statistical analysis conducted on geographies consisting of 77,902,509 people shows no correlation between the proportion of Immigrants from Bahamas and percentage of population with a disability under the age of 5 in the United States with a correlation coefficient (R) of 0.002 and weighted average of 1.2%. Similarly, the statistical analysis conducted on geographies consisting of 136,122,823 people shows a significant positive correlation between the proportion of Latvians and percentage of population with a disability under the age of 5 in the United States with a correlation coefficient (R) of 0.655 and weighted average of 1.3%, a difference of 5.3%.
Disability Age Under 5 Correlation Summary
| Measurement | Immigrants from Bahamas | Latvian |
| Minimum | 0.28% | 0.93% |
| Maximum | 4.6% | 5.6% |
| Range | 4.3% | 4.6% |
| Mean | 1.5% | 2.8% |
| Median | 1.3% | 2.3% |
| Interquartile 25% (IQ1) | 0.85% | 1.7% |
| Interquartile 75% (IQ3) | 1.7% | 3.9% |
| Interquartile Range (IQR) | 0.82% | 2.2% |
| Standard Deviation (Sample) | 1.1% | 1.3% |
| Standard Deviation (Population) | 1.0% | 1.3% |
Similar Demographics by Disability Age Under 5
Demographics Similar to Immigrants from Bahamas by Disability Age Under 5
In terms of disability age under 5, the demographic groups most similar to Immigrants from Bahamas are Immigrants from Mexico (1.2%, a difference of 0.070%), Immigrants from Peru (1.2%, a difference of 0.13%), Macedonian (1.2%, a difference of 0.13%), Venezuelan (1.2%, a difference of 0.17%), and Immigrants from Saudi Arabia (1.2%, a difference of 0.17%).
| Demographics | Rating | Rank | Disability Age Under 5 |
| Crow | 51.0 /100 | #172 | Average 1.2% |
| Immigrants | Ireland | 50.3 /100 | #173 | Average 1.2% |
| Immigrants | Latvia | 50.0 /100 | #174 | Average 1.2% |
| Immigrants | Nigeria | 50.0 /100 | #175 | Average 1.2% |
| Immigrants | Kenya | 48.6 /100 | #176 | Average 1.2% |
| Comanche | 47.5 /100 | #177 | Average 1.2% |
| Venezuelans | 47.1 /100 | #178 | Average 1.2% |
| Immigrants | Bahamas | 45.2 /100 | #179 | Average 1.2% |
| Immigrants | Mexico | 44.4 /100 | #180 | Average 1.2% |
| Immigrants | Peru | 43.7 /100 | #181 | Average 1.2% |
| Macedonians | 43.7 /100 | #181 | Average 1.2% |
| Immigrants | Saudi Arabia | 43.3 /100 | #183 | Average 1.2% |
| Palestinians | 43.0 /100 | #184 | Average 1.2% |
| Immigrants | Western Africa | 42.5 /100 | #185 | Average 1.2% |
| Cubans | 42.5 /100 | #186 | Average 1.2% |
Demographics Similar to Latvians by Disability Age Under 5
In terms of disability age under 5, the demographic groups most similar to Latvians are Panamanian (1.3%, a difference of 0.030%), Bahamian (1.3%, a difference of 0.030%), Hispanic or Latino (1.3%, a difference of 0.16%), Subsaharan African (1.3%, a difference of 0.35%), and Ukrainian (1.3%, a difference of 0.35%).
| Demographics | Rating | Rank | Disability Age Under 5 |
| Cypriots | 14.9 /100 | #217 | Poor 1.3% |
| Malaysians | 13.2 /100 | #218 | Poor 1.3% |
| Immigrants | Croatia | 11.2 /100 | #219 | Poor 1.3% |
| Serbians | 9.6 /100 | #220 | Tragic 1.3% |
| Sub-Saharan Africans | 8.3 /100 | #221 | Tragic 1.3% |
| Ukrainians | 8.3 /100 | #222 | Tragic 1.3% |
| Hispanics or Latinos | 7.7 /100 | #223 | Tragic 1.3% |
| Latvians | 7.1 /100 | #224 | Tragic 1.3% |
| Panamanians | 7.1 /100 | #225 | Tragic 1.3% |
| Bahamians | 7.1 /100 | #226 | Tragic 1.3% |
| Taiwanese | 6.1 /100 | #227 | Tragic 1.3% |
| Luxembourgers | 6.1 /100 | #228 | Tragic 1.3% |
| Immigrants | Costa Rica | 5.5 /100 | #229 | Tragic 1.3% |
| Lebanese | 5.3 /100 | #230 | Tragic 1.3% |
| Immigrants | Northern Europe | 4.7 /100 | #231 | Tragic 1.3% |