Filipino vs Latvian Disability Age Under 5
COMPARE
Filipino
Latvian
Disability Age Under 5
Disability Age Under 5 Comparison
Filipinos
Latvians
1.1%
DISABILITY AGE UNDER 5
99.9/ 100
METRIC RATING
39th/ 347
METRIC RANK
1.3%
DISABILITY AGE UNDER 5
7.1/ 100
METRIC RATING
224th/ 347
METRIC RANK
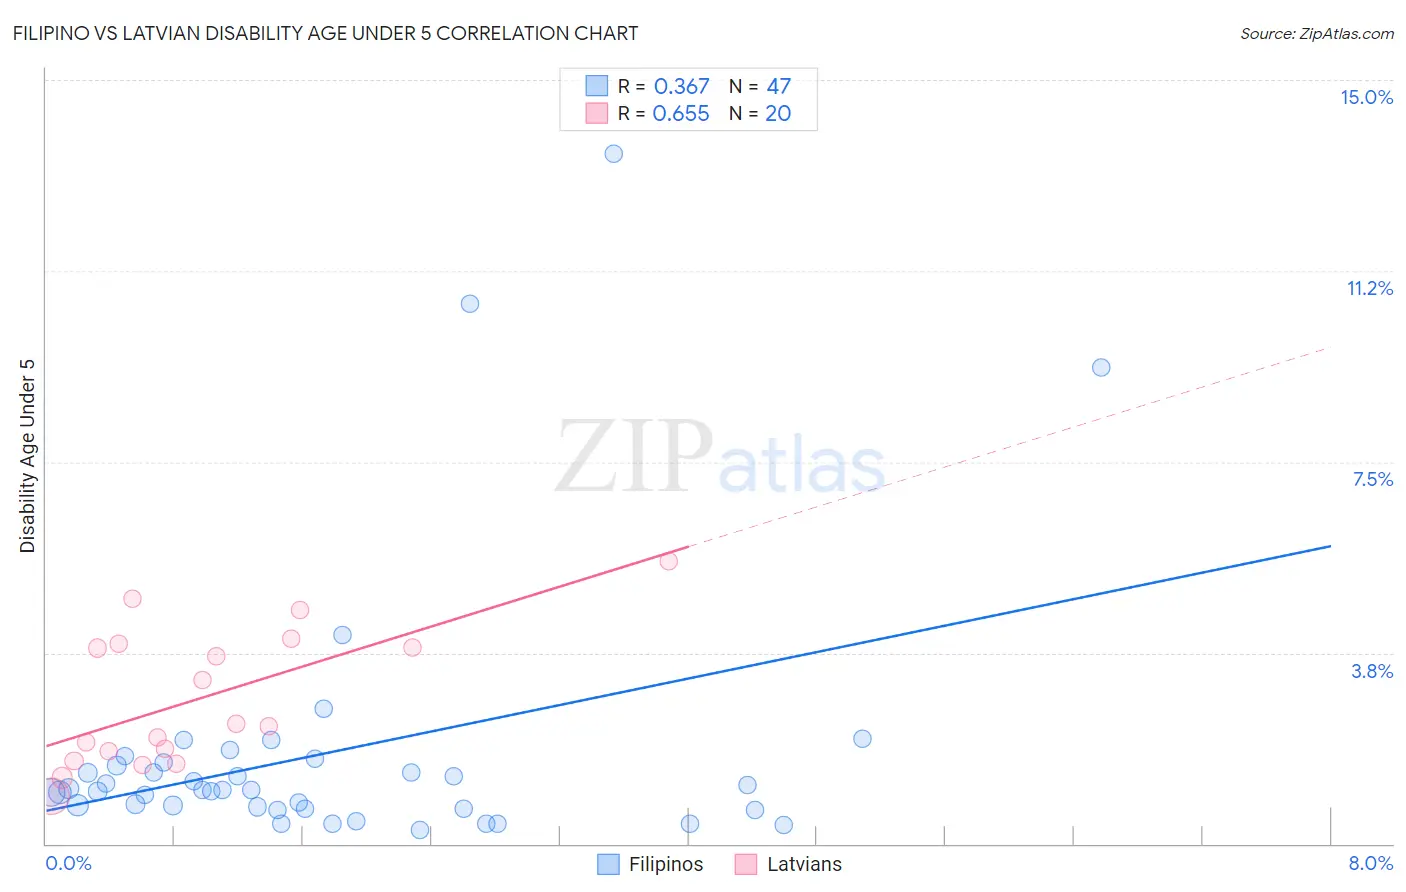
Filipino vs Latvian Disability Age Under 5 Correlation Chart
The statistical analysis conducted on geographies consisting of 154,851,342 people shows a mild positive correlation between the proportion of Filipinos and percentage of population with a disability under the age of 5 in the United States with a correlation coefficient (R) of 0.367 and weighted average of 1.1%. Similarly, the statistical analysis conducted on geographies consisting of 136,122,823 people shows a significant positive correlation between the proportion of Latvians and percentage of population with a disability under the age of 5 in the United States with a correlation coefficient (R) of 0.655 and weighted average of 1.3%, a difference of 24.7%.
Disability Age Under 5 Correlation Summary
| Measurement | Filipino | Latvian |
| Minimum | 0.27% | 0.93% |
| Maximum | 13.6% | 5.6% |
| Range | 13.3% | 4.6% |
| Mean | 1.8% | 2.8% |
| Median | 1.1% | 2.3% |
| Interquartile 25% (IQ1) | 0.69% | 1.7% |
| Interquartile 75% (IQ3) | 1.6% | 3.9% |
| Interquartile Range (IQR) | 0.90% | 2.2% |
| Standard Deviation (Sample) | 2.6% | 1.3% |
| Standard Deviation (Population) | 2.6% | 1.3% |
Similar Demographics by Disability Age Under 5
Demographics Similar to Filipinos by Disability Age Under 5
In terms of disability age under 5, the demographic groups most similar to Filipinos are Immigrants from Albania (1.1%, a difference of 0.33%), Immigrants from Guyana (1.0%, a difference of 0.67%), Thai (1.1%, a difference of 0.74%), Immigrants from India (1.0%, a difference of 0.76%), and Immigrants from Nepal (1.0%, a difference of 0.78%).
| Demographics | Rating | Rank | Disability Age Under 5 |
| Iranians | 99.9 /100 | #32 | Exceptional 1.0% |
| Bolivians | 99.9 /100 | #33 | Exceptional 1.0% |
| Immigrants | Ukraine | 99.9 /100 | #34 | Exceptional 1.0% |
| Barbadians | 99.9 /100 | #35 | Exceptional 1.0% |
| Immigrants | Nepal | 99.9 /100 | #36 | Exceptional 1.0% |
| Immigrants | India | 99.9 /100 | #37 | Exceptional 1.0% |
| Immigrants | Guyana | 99.9 /100 | #38 | Exceptional 1.0% |
| Filipinos | 99.9 /100 | #39 | Exceptional 1.1% |
| Immigrants | Albania | 99.9 /100 | #40 | Exceptional 1.1% |
| Thais | 99.8 /100 | #41 | Exceptional 1.1% |
| Immigrants | Bulgaria | 99.8 /100 | #42 | Exceptional 1.1% |
| Pima | 99.8 /100 | #43 | Exceptional 1.1% |
| Immigrants | Asia | 99.8 /100 | #44 | Exceptional 1.1% |
| Immigrants | Turkey | 99.8 /100 | #45 | Exceptional 1.1% |
| Immigrants | Congo | 99.8 /100 | #46 | Exceptional 1.1% |
Demographics Similar to Latvians by Disability Age Under 5
In terms of disability age under 5, the demographic groups most similar to Latvians are Panamanian (1.3%, a difference of 0.030%), Bahamian (1.3%, a difference of 0.030%), Hispanic or Latino (1.3%, a difference of 0.16%), Subsaharan African (1.3%, a difference of 0.35%), and Ukrainian (1.3%, a difference of 0.35%).
| Demographics | Rating | Rank | Disability Age Under 5 |
| Cypriots | 14.9 /100 | #217 | Poor 1.3% |
| Malaysians | 13.2 /100 | #218 | Poor 1.3% |
| Immigrants | Croatia | 11.2 /100 | #219 | Poor 1.3% |
| Serbians | 9.6 /100 | #220 | Tragic 1.3% |
| Sub-Saharan Africans | 8.3 /100 | #221 | Tragic 1.3% |
| Ukrainians | 8.3 /100 | #222 | Tragic 1.3% |
| Hispanics or Latinos | 7.7 /100 | #223 | Tragic 1.3% |
| Latvians | 7.1 /100 | #224 | Tragic 1.3% |
| Panamanians | 7.1 /100 | #225 | Tragic 1.3% |
| Bahamians | 7.1 /100 | #226 | Tragic 1.3% |
| Taiwanese | 6.1 /100 | #227 | Tragic 1.3% |
| Luxembourgers | 6.1 /100 | #228 | Tragic 1.3% |
| Immigrants | Costa Rica | 5.5 /100 | #229 | Tragic 1.3% |
| Lebanese | 5.3 /100 | #230 | Tragic 1.3% |
| Immigrants | Northern Europe | 4.7 /100 | #231 | Tragic 1.3% |