Tlingit-Haida vs Immigrants from Cabo Verde Disability Age Under 5
COMPARE
Tlingit-Haida
Immigrants from Cabo Verde
Disability Age Under 5
Disability Age Under 5 Comparison
Tlingit-Haida
Immigrants from Cabo Verde
1.5%
DISABILITY AGE UNDER 5
0.0/ 100
METRIC RATING
286th/ 347
METRIC RANK
1.7%
DISABILITY AGE UNDER 5
0.0/ 100
METRIC RATING
316th/ 347
METRIC RANK
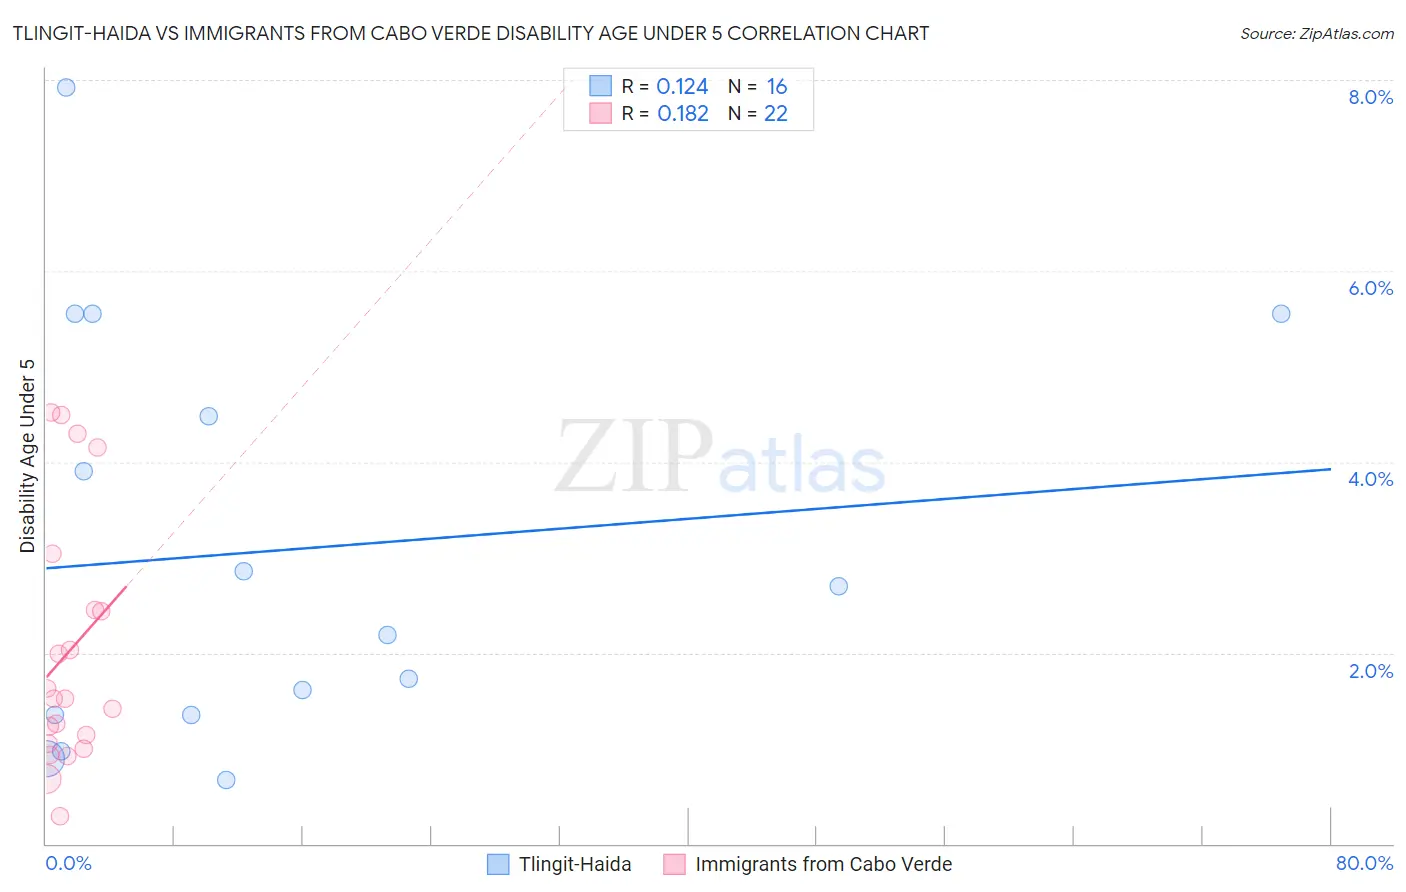
Tlingit-Haida vs Immigrants from Cabo Verde Disability Age Under 5 Correlation Chart
The statistical analysis conducted on geographies consisting of 46,863,169 people shows a poor positive correlation between the proportion of Tlingit-Haida and percentage of population with a disability under the age of 5 in the United States with a correlation coefficient (R) of 0.124 and weighted average of 1.5%. Similarly, the statistical analysis conducted on geographies consisting of 31,314,274 people shows a poor positive correlation between the proportion of Immigrants from Cabo Verde and percentage of population with a disability under the age of 5 in the United States with a correlation coefficient (R) of 0.182 and weighted average of 1.7%, a difference of 9.2%.
Disability Age Under 5 Correlation Summary
| Measurement | Tlingit-Haida | Immigrants from Cabo Verde |
| Minimum | 0.66% | 0.28% |
| Maximum | 7.9% | 4.5% |
| Range | 7.3% | 4.2% |
| Mean | 3.1% | 2.0% |
| Median | 2.4% | 1.5% |
| Interquartile 25% (IQ1) | 1.3% | 1.0% |
| Interquartile 75% (IQ3) | 5.0% | 2.4% |
| Interquartile Range (IQR) | 3.7% | 1.4% |
| Standard Deviation (Sample) | 2.2% | 1.3% |
| Standard Deviation (Population) | 2.1% | 1.3% |
Similar Demographics by Disability Age Under 5
Demographics Similar to Tlingit-Haida by Disability Age Under 5
In terms of disability age under 5, the demographic groups most similar to Tlingit-Haida are Scandinavian (1.5%, a difference of 0.050%), Estonian (1.5%, a difference of 0.23%), Croatian (1.5%, a difference of 0.25%), Hungarian (1.5%, a difference of 0.37%), and Czech (1.5%, a difference of 0.50%).
| Demographics | Rating | Rank | Disability Age Under 5 |
| Danes | 0.0 /100 | #279 | Tragic 1.5% |
| British | 0.0 /100 | #280 | Tragic 1.5% |
| Czechoslovakians | 0.0 /100 | #281 | Tragic 1.5% |
| Cheyenne | 0.0 /100 | #282 | Tragic 1.5% |
| Delaware | 0.0 /100 | #283 | Tragic 1.5% |
| Europeans | 0.0 /100 | #284 | Tragic 1.5% |
| Croatians | 0.0 /100 | #285 | Tragic 1.5% |
| Tlingit-Haida | 0.0 /100 | #286 | Tragic 1.5% |
| Scandinavians | 0.0 /100 | #287 | Tragic 1.5% |
| Estonians | 0.0 /100 | #288 | Tragic 1.5% |
| Hungarians | 0.0 /100 | #289 | Tragic 1.5% |
| Czechs | 0.0 /100 | #290 | Tragic 1.5% |
| Northern Europeans | 0.0 /100 | #291 | Tragic 1.6% |
| Italians | 0.0 /100 | #292 | Tragic 1.6% |
| Lithuanians | 0.0 /100 | #293 | Tragic 1.6% |
Demographics Similar to Immigrants from Cabo Verde by Disability Age Under 5
In terms of disability age under 5, the demographic groups most similar to Immigrants from Cabo Verde are Dutch (1.7%, a difference of 0.18%), French (1.7%, a difference of 0.42%), Norwegian (1.7%, a difference of 0.44%), Celtic (1.7%, a difference of 0.60%), and Irish (1.7%, a difference of 0.69%).
| Demographics | Rating | Rank | Disability Age Under 5 |
| Cape Verdeans | 0.0 /100 | #309 | Tragic 1.7% |
| Whites/Caucasians | 0.0 /100 | #310 | Tragic 1.7% |
| English | 0.0 /100 | #311 | Tragic 1.7% |
| Puerto Ricans | 0.0 /100 | #312 | Tragic 1.7% |
| Celtics | 0.0 /100 | #313 | Tragic 1.7% |
| Norwegians | 0.0 /100 | #314 | Tragic 1.7% |
| Dutch | 0.0 /100 | #315 | Tragic 1.7% |
| Immigrants | Cabo Verde | 0.0 /100 | #316 | Tragic 1.7% |
| French | 0.0 /100 | #317 | Tragic 1.7% |
| Irish | 0.0 /100 | #318 | Tragic 1.7% |
| Slovaks | 0.0 /100 | #319 | Tragic 1.7% |
| Scotch-Irish | 0.0 /100 | #320 | Tragic 1.7% |
| Ottawa | 0.0 /100 | #321 | Tragic 1.7% |
| Germans | 0.0 /100 | #322 | Tragic 1.7% |
| Chickasaw | 0.0 /100 | #323 | Tragic 1.7% |