Tlingit-Haida vs Latvian Divorced or Separated
COMPARE
Tlingit-Haida
Latvian
Divorced or Separated
Divorced or Separated Comparison
Tlingit-Haida
Latvians
13.2%
DIVORCED OR SEPARATED
0.0/ 100
METRIC RATING
306th/ 347
METRIC RANK
11.6%
DIVORCED OR SEPARATED
98.7/ 100
METRIC RATING
97th/ 347
METRIC RANK
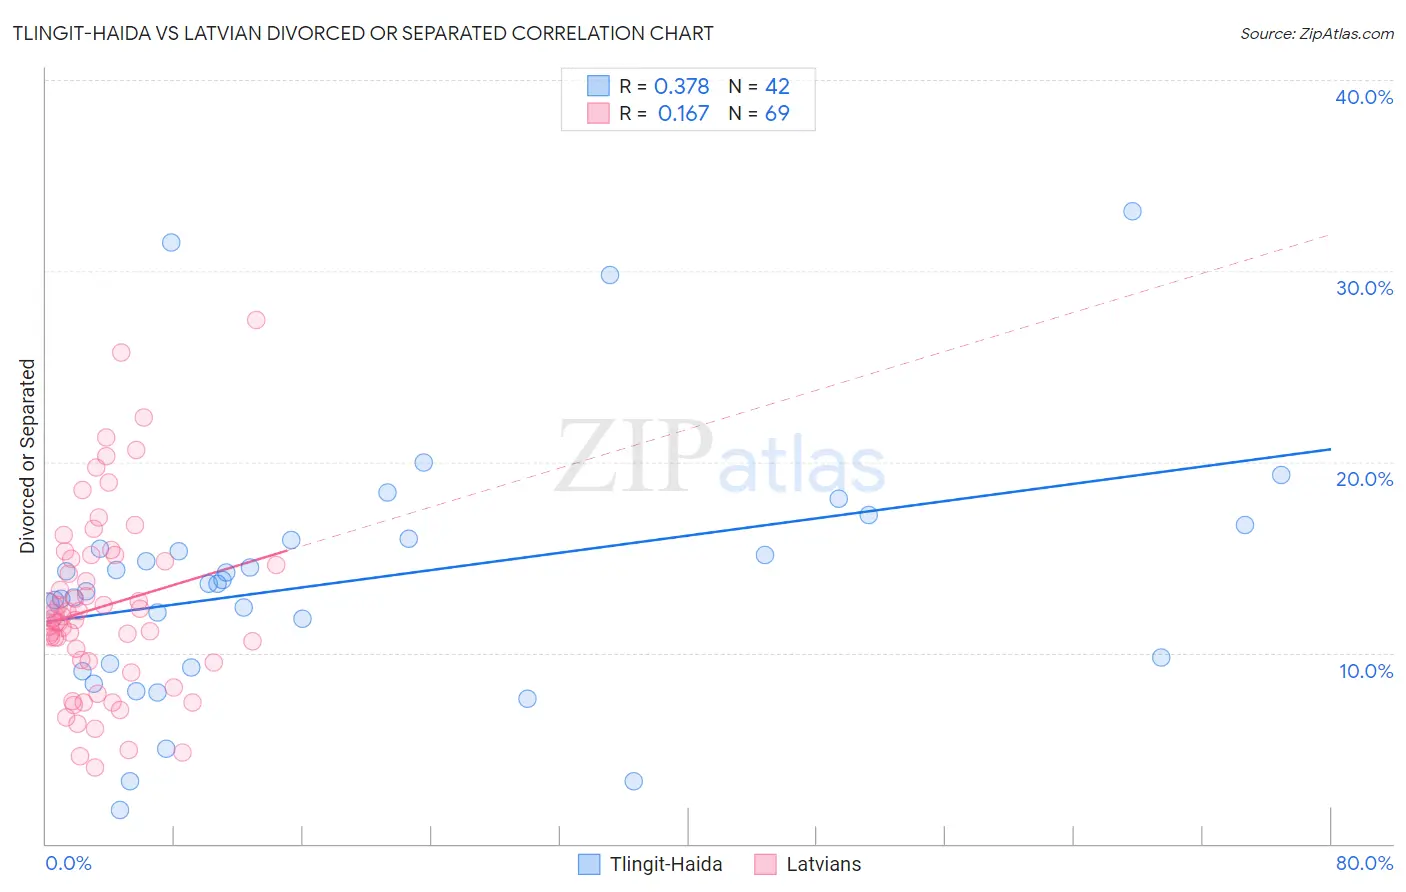
Tlingit-Haida vs Latvian Divorced or Separated Correlation Chart
The statistical analysis conducted on geographies consisting of 60,872,098 people shows a mild positive correlation between the proportion of Tlingit-Haida and percentage of population currently divorced or separated in the United States with a correlation coefficient (R) of 0.378 and weighted average of 13.2%. Similarly, the statistical analysis conducted on geographies consisting of 220,642,308 people shows a poor positive correlation between the proportion of Latvians and percentage of population currently divorced or separated in the United States with a correlation coefficient (R) of 0.167 and weighted average of 11.6%, a difference of 13.6%.
Divorced or Separated Correlation Summary
| Measurement | Tlingit-Haida | Latvian |
| Minimum | 1.8% | 4.0% |
| Maximum | 33.1% | 27.4% |
| Range | 31.3% | 23.4% |
| Mean | 13.8% | 12.4% |
| Median | 13.6% | 11.8% |
| Interquartile 25% (IQ1) | 9.4% | 9.5% |
| Interquartile 75% (IQ3) | 15.9% | 15.0% |
| Interquartile Range (IQR) | 6.5% | 5.5% |
| Standard Deviation (Sample) | 6.6% | 4.8% |
| Standard Deviation (Population) | 6.5% | 4.8% |
Similar Demographics by Divorced or Separated
Demographics Similar to Tlingit-Haida by Divorced or Separated
In terms of divorced or separated, the demographic groups most similar to Tlingit-Haida are Chippewa (13.2%, a difference of 0.16%), Hopi (13.2%, a difference of 0.22%), French American Indian (13.2%, a difference of 0.25%), Ottawa (13.2%, a difference of 0.34%), and Cape Verdean (13.1%, a difference of 0.35%).
| Demographics | Rating | Rank | Divorced or Separated |
| Immigrants | Jamaica | 0.0 /100 | #299 | Tragic 13.0% |
| Immigrants | Cabo Verde | 0.0 /100 | #300 | Tragic 13.1% |
| Alaskan Athabascans | 0.0 /100 | #301 | Tragic 13.1% |
| Immigrants | Venezuela | 0.0 /100 | #302 | Tragic 13.1% |
| Cape Verdeans | 0.0 /100 | #303 | Tragic 13.1% |
| Hopi | 0.0 /100 | #304 | Tragic 13.2% |
| Chippewa | 0.0 /100 | #305 | Tragic 13.2% |
| Tlingit-Haida | 0.0 /100 | #306 | Tragic 13.2% |
| French American Indians | 0.0 /100 | #307 | Tragic 13.2% |
| Ottawa | 0.0 /100 | #308 | Tragic 13.2% |
| Americans | 0.0 /100 | #309 | Tragic 13.2% |
| Africans | 0.0 /100 | #310 | Tragic 13.2% |
| Sioux | 0.0 /100 | #311 | Tragic 13.2% |
| Blackfeet | 0.0 /100 | #312 | Tragic 13.3% |
| Immigrants | Nicaragua | 0.0 /100 | #313 | Tragic 13.3% |
Demographics Similar to Latvians by Divorced or Separated
In terms of divorced or separated, the demographic groups most similar to Latvians are Immigrants from Ukraine (11.6%, a difference of 0.030%), Immigrants from Jordan (11.6%, a difference of 0.040%), Immigrants from Serbia (11.6%, a difference of 0.050%), Immigrants from Sweden (11.6%, a difference of 0.060%), and Immigrants from Northern Europe (11.6%, a difference of 0.090%).
| Demographics | Rating | Rank | Divorced or Separated |
| Zimbabweans | 99.0 /100 | #90 | Exceptional 11.6% |
| Spanish American Indians | 99.0 /100 | #91 | Exceptional 11.6% |
| Immigrants | Denmark | 98.9 /100 | #92 | Exceptional 11.6% |
| Arabs | 98.9 /100 | #93 | Exceptional 11.6% |
| Immigrants | Fiji | 98.9 /100 | #94 | Exceptional 11.6% |
| Immigrants | Serbia | 98.8 /100 | #95 | Exceptional 11.6% |
| Immigrants | Ukraine | 98.7 /100 | #96 | Exceptional 11.6% |
| Latvians | 98.7 /100 | #97 | Exceptional 11.6% |
| Immigrants | Jordan | 98.6 /100 | #98 | Exceptional 11.6% |
| Immigrants | Sweden | 98.6 /100 | #99 | Exceptional 11.6% |
| Immigrants | Northern Europe | 98.6 /100 | #100 | Exceptional 11.6% |
| Immigrants | Guyana | 98.5 /100 | #101 | Exceptional 11.6% |
| Immigrants | Croatia | 98.3 /100 | #102 | Exceptional 11.6% |
| Maltese | 98.2 /100 | #103 | Exceptional 11.6% |
| Salvadorans | 98.2 /100 | #104 | Exceptional 11.6% |