Tlingit-Haida vs Latvian Births to Unmarried Women
COMPARE
Tlingit-Haida
Latvian
Births to Unmarried Women
Births to Unmarried Women Comparison
Tlingit-Haida
Latvians
32.2%
BIRTHS TO UNMARRIED WOMEN
32.6/ 100
METRIC RATING
190th/ 347
METRIC RANK
27.7%
BIRTHS TO UNMARRIED WOMEN
99.5/ 100
METRIC RATING
45th/ 347
METRIC RANK
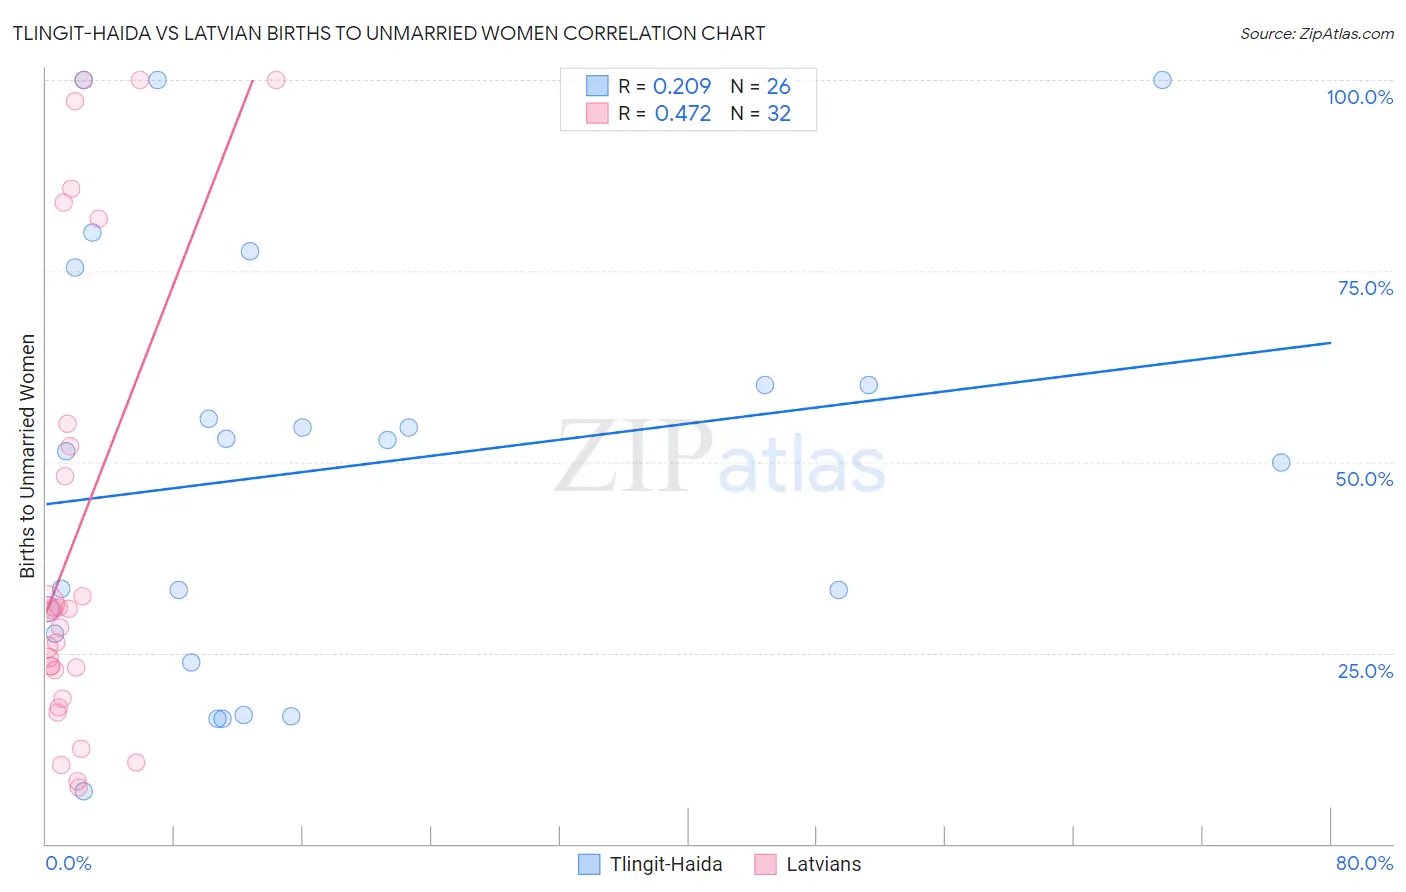
Tlingit-Haida vs Latvian Births to Unmarried Women Correlation Chart
The statistical analysis conducted on geographies consisting of 59,376,059 people shows a weak positive correlation between the proportion of Tlingit-Haida and percentage of births to unmarried women in the United States with a correlation coefficient (R) of 0.209 and weighted average of 32.2%. Similarly, the statistical analysis conducted on geographies consisting of 206,794,611 people shows a moderate positive correlation between the proportion of Latvians and percentage of births to unmarried women in the United States with a correlation coefficient (R) of 0.472 and weighted average of 27.7%, a difference of 16.2%.
Births to Unmarried Women Correlation Summary
| Measurement | Tlingit-Haida | Latvian |
| Minimum | 6.9% | 7.4% |
| Maximum | 100.0% | 100.0% |
| Range | 93.1% | 92.6% |
| Mean | 49.2% | 40.3% |
| Median | 52.2% | 29.5% |
| Interquartile 25% (IQ1) | 27.6% | 20.8% |
| Interquartile 75% (IQ3) | 60.0% | 53.6% |
| Interquartile Range (IQR) | 32.4% | 32.7% |
| Standard Deviation (Sample) | 27.4% | 30.4% |
| Standard Deviation (Population) | 26.9% | 29.9% |
Similar Demographics by Births to Unmarried Women
Demographics Similar to Tlingit-Haida by Births to Unmarried Women
In terms of births to unmarried women, the demographic groups most similar to Tlingit-Haida are Irish (32.2%, a difference of 0.020%), Colombian (32.2%, a difference of 0.080%), Fijian (32.3%, a difference of 0.17%), Immigrants from Kenya (32.1%, a difference of 0.44%), and Osage (32.1%, a difference of 0.47%).
| Demographics | Rating | Rank | Births to Unmarried Women |
| Canadians | 41.4 /100 | #183 | Average 31.9% |
| Immigrants | South America | 40.7 /100 | #184 | Average 32.0% |
| Germans | 39.5 /100 | #185 | Fair 32.0% |
| Welsh | 38.2 /100 | #186 | Fair 32.0% |
| Czechoslovakians | 38.0 /100 | #187 | Fair 32.0% |
| Osage | 37.1 /100 | #188 | Fair 32.1% |
| Immigrants | Kenya | 36.9 /100 | #189 | Fair 32.1% |
| Tlingit-Haida | 32.6 /100 | #190 | Fair 32.2% |
| Irish | 32.4 /100 | #191 | Fair 32.2% |
| Colombians | 31.9 /100 | #192 | Fair 32.2% |
| Fijians | 31.1 /100 | #193 | Fair 32.3% |
| Sudanese | 27.3 /100 | #194 | Fair 32.4% |
| Samoans | 21.9 /100 | #195 | Fair 32.6% |
| Immigrants | Colombia | 21.7 /100 | #196 | Fair 32.6% |
| Immigrants | Immigrants | 20.6 /100 | #197 | Fair 32.7% |
Demographics Similar to Latvians by Births to Unmarried Women
In terms of births to unmarried women, the demographic groups most similar to Latvians are Immigrants from Lithuania (27.7%, a difference of 0.040%), Hmong (27.7%, a difference of 0.040%), Eastern European (27.7%, a difference of 0.060%), Immigrants from Indonesia (27.7%, a difference of 0.090%), and Immigrants from Greece (27.8%, a difference of 0.24%).
| Demographics | Rating | Rank | Births to Unmarried Women |
| Immigrants | Moldova | 99.7 /100 | #38 | Exceptional 27.3% |
| Immigrants | Malaysia | 99.7 /100 | #39 | Exceptional 27.4% |
| Turks | 99.6 /100 | #40 | Exceptional 27.4% |
| Iraqis | 99.6 /100 | #41 | Exceptional 27.6% |
| Immigrants | Eastern Europe | 99.6 /100 | #42 | Exceptional 27.6% |
| Immigrants | Bulgaria | 99.6 /100 | #43 | Exceptional 27.6% |
| Immigrants | Indonesia | 99.5 /100 | #44 | Exceptional 27.7% |
| Latvians | 99.5 /100 | #45 | Exceptional 27.7% |
| Immigrants | Lithuania | 99.5 /100 | #46 | Exceptional 27.7% |
| Hmong | 99.5 /100 | #47 | Exceptional 27.7% |
| Eastern Europeans | 99.5 /100 | #48 | Exceptional 27.7% |
| Immigrants | Greece | 99.4 /100 | #49 | Exceptional 27.8% |
| Maltese | 99.4 /100 | #50 | Exceptional 27.8% |
| Macedonians | 99.4 /100 | #51 | Exceptional 27.9% |
| Bhutanese | 99.4 /100 | #52 | Exceptional 27.9% |