Black/African American vs Latvian Disability Age Under 5
COMPARE
Black/African American
Latvian
Disability Age Under 5
Disability Age Under 5 Comparison
Blacks/African Americans
Latvians
1.4%
DISABILITY AGE UNDER 5
0.1/ 100
METRIC RATING
272nd/ 347
METRIC RANK
1.3%
DISABILITY AGE UNDER 5
7.1/ 100
METRIC RATING
224th/ 347
METRIC RANK
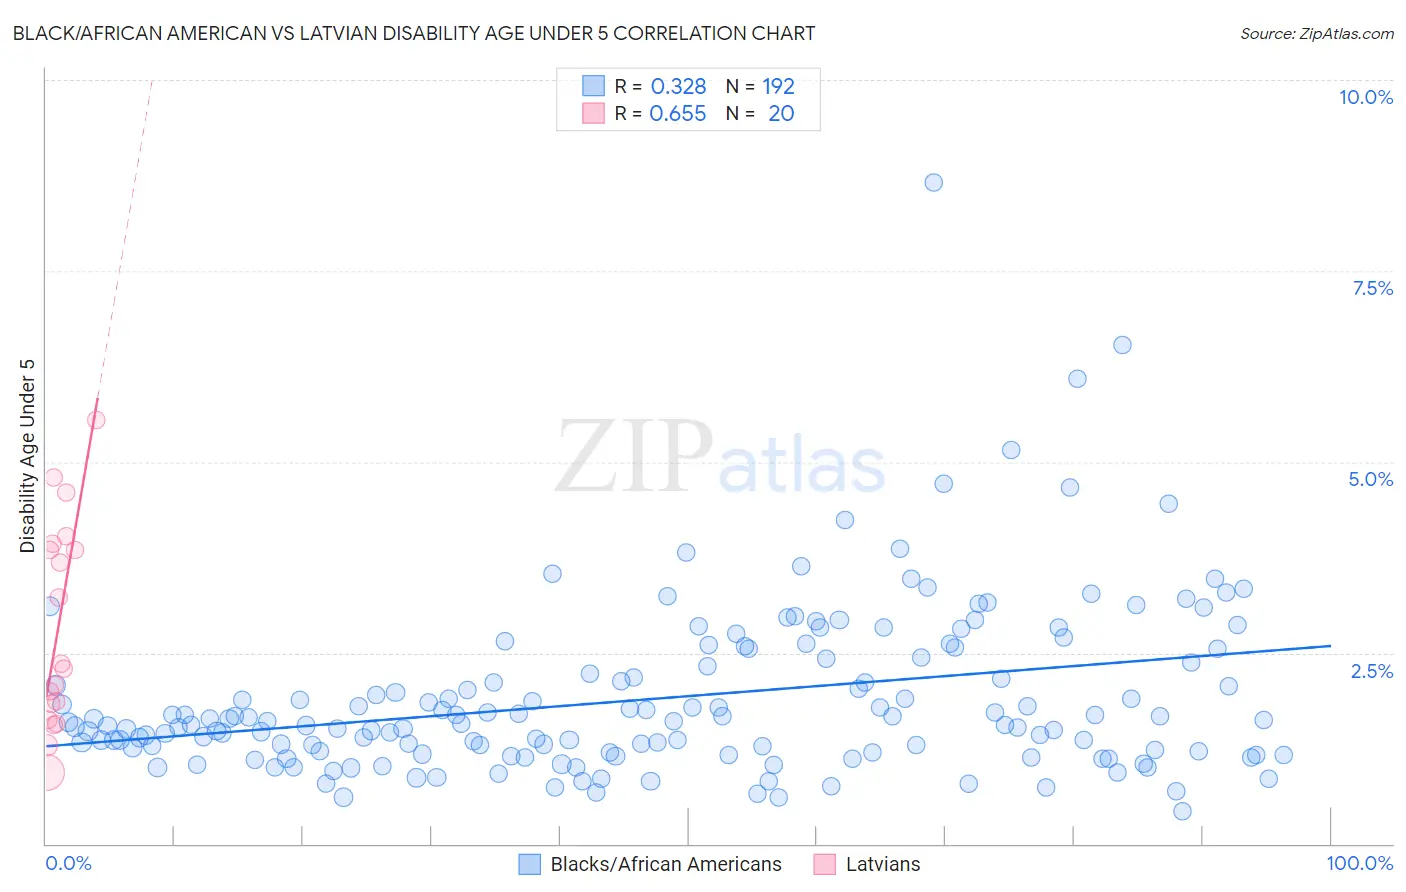
Black/African American vs Latvian Disability Age Under 5 Correlation Chart
The statistical analysis conducted on geographies consisting of 261,159,636 people shows a mild positive correlation between the proportion of Blacks/African Americans and percentage of population with a disability under the age of 5 in the United States with a correlation coefficient (R) of 0.328 and weighted average of 1.4%. Similarly, the statistical analysis conducted on geographies consisting of 136,122,823 people shows a significant positive correlation between the proportion of Latvians and percentage of population with a disability under the age of 5 in the United States with a correlation coefficient (R) of 0.655 and weighted average of 1.3%, a difference of 10.3%.
Disability Age Under 5 Correlation Summary
| Measurement | Black/African American | Latvian |
| Minimum | 0.43% | 0.93% |
| Maximum | 8.7% | 5.6% |
| Range | 8.2% | 4.6% |
| Mean | 1.9% | 2.8% |
| Median | 1.6% | 2.3% |
| Interquartile 25% (IQ1) | 1.2% | 1.7% |
| Interquartile 75% (IQ3) | 2.4% | 3.9% |
| Interquartile Range (IQR) | 1.2% | 2.2% |
| Standard Deviation (Sample) | 1.1% | 1.3% |
| Standard Deviation (Population) | 1.1% | 1.3% |
Similar Demographics by Disability Age Under 5
Demographics Similar to Blacks/African Americans by Disability Age Under 5
In terms of disability age under 5, the demographic groups most similar to Blacks/African Americans are Immigrants from Canada (1.4%, a difference of 0.16%), Immigrants from North America (1.4%, a difference of 0.20%), Alaskan Athabascan (1.5%, a difference of 0.29%), Austrian (1.4%, a difference of 0.33%), and Belgian (1.4%, a difference of 0.51%).
| Demographics | Rating | Rank | Disability Age Under 5 |
| Carpatho Rusyns | 0.1 /100 | #265 | Tragic 1.4% |
| Immigrants | Germany | 0.1 /100 | #266 | Tragic 1.4% |
| Cree | 0.1 /100 | #267 | Tragic 1.4% |
| Belgians | 0.1 /100 | #268 | Tragic 1.4% |
| Austrians | 0.1 /100 | #269 | Tragic 1.4% |
| Immigrants | North America | 0.1 /100 | #270 | Tragic 1.4% |
| Immigrants | Canada | 0.1 /100 | #271 | Tragic 1.4% |
| Blacks/African Americans | 0.1 /100 | #272 | Tragic 1.4% |
| Alaskan Athabascans | 0.1 /100 | #273 | Tragic 1.5% |
| Iroquois | 0.0 /100 | #274 | Tragic 1.5% |
| Brazilians | 0.0 /100 | #275 | Tragic 1.5% |
| Greeks | 0.0 /100 | #276 | Tragic 1.5% |
| Canadians | 0.0 /100 | #277 | Tragic 1.5% |
| Kiowa | 0.0 /100 | #278 | Tragic 1.5% |
| Danes | 0.0 /100 | #279 | Tragic 1.5% |
Demographics Similar to Latvians by Disability Age Under 5
In terms of disability age under 5, the demographic groups most similar to Latvians are Panamanian (1.3%, a difference of 0.030%), Bahamian (1.3%, a difference of 0.030%), Hispanic or Latino (1.3%, a difference of 0.16%), Subsaharan African (1.3%, a difference of 0.35%), and Ukrainian (1.3%, a difference of 0.35%).
| Demographics | Rating | Rank | Disability Age Under 5 |
| Cypriots | 14.9 /100 | #217 | Poor 1.3% |
| Malaysians | 13.2 /100 | #218 | Poor 1.3% |
| Immigrants | Croatia | 11.2 /100 | #219 | Poor 1.3% |
| Serbians | 9.6 /100 | #220 | Tragic 1.3% |
| Sub-Saharan Africans | 8.3 /100 | #221 | Tragic 1.3% |
| Ukrainians | 8.3 /100 | #222 | Tragic 1.3% |
| Hispanics or Latinos | 7.7 /100 | #223 | Tragic 1.3% |
| Latvians | 7.1 /100 | #224 | Tragic 1.3% |
| Panamanians | 7.1 /100 | #225 | Tragic 1.3% |
| Bahamians | 7.1 /100 | #226 | Tragic 1.3% |
| Taiwanese | 6.1 /100 | #227 | Tragic 1.3% |
| Luxembourgers | 6.1 /100 | #228 | Tragic 1.3% |
| Immigrants | Costa Rica | 5.5 /100 | #229 | Tragic 1.3% |
| Lebanese | 5.3 /100 | #230 | Tragic 1.3% |
| Immigrants | Northern Europe | 4.7 /100 | #231 | Tragic 1.3% |