Tlingit-Haida vs South African Disability Age Under 5
COMPARE
Tlingit-Haida
South African
Disability Age Under 5
Disability Age Under 5 Comparison
Tlingit-Haida
South Africans
1.5%
DISABILITY AGE UNDER 5
0.0/ 100
METRIC RATING
286th/ 347
METRIC RANK
1.1%
DISABILITY AGE UNDER 5
98.7/ 100
METRIC RATING
68th/ 347
METRIC RANK
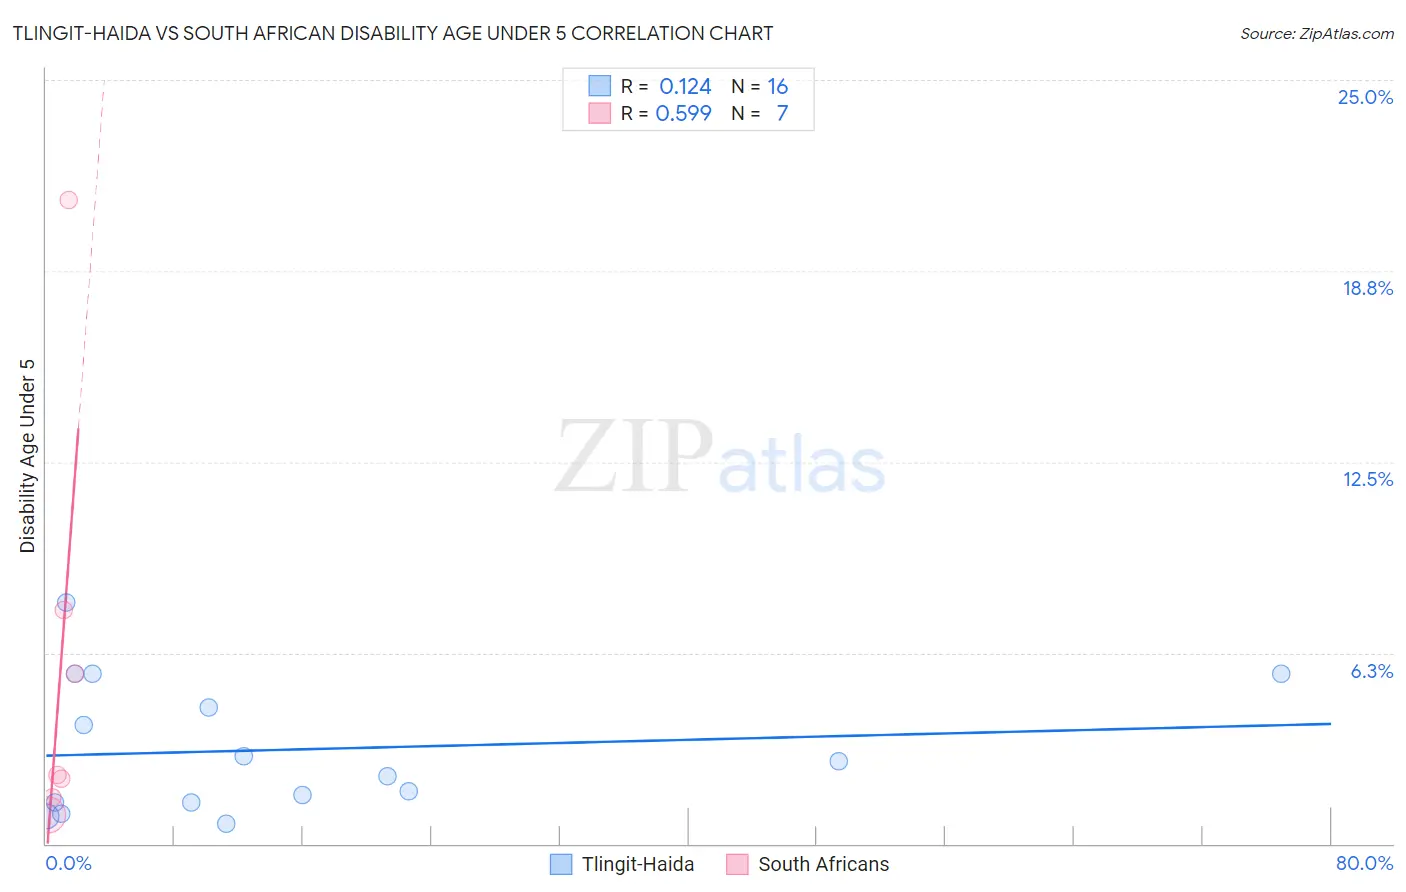
Tlingit-Haida vs South African Disability Age Under 5 Correlation Chart
The statistical analysis conducted on geographies consisting of 46,863,169 people shows a poor positive correlation between the proportion of Tlingit-Haida and percentage of population with a disability under the age of 5 in the United States with a correlation coefficient (R) of 0.124 and weighted average of 1.5%. Similarly, the statistical analysis conducted on geographies consisting of 120,529,150 people shows a substantial positive correlation between the proportion of South Africans and percentage of population with a disability under the age of 5 in the United States with a correlation coefficient (R) of 0.599 and weighted average of 1.1%, a difference of 37.9%.
Disability Age Under 5 Correlation Summary
| Measurement | Tlingit-Haida | South African |
| Minimum | 0.66% | 0.96% |
| Maximum | 7.9% | 21.1% |
| Range | 7.3% | 20.1% |
| Mean | 3.1% | 5.9% |
| Median | 2.4% | 2.3% |
| Interquartile 25% (IQ1) | 1.3% | 1.5% |
| Interquartile 75% (IQ3) | 5.0% | 7.7% |
| Interquartile Range (IQR) | 3.7% | 6.1% |
| Standard Deviation (Sample) | 2.2% | 7.1% |
| Standard Deviation (Population) | 2.1% | 6.6% |
Similar Demographics by Disability Age Under 5
Demographics Similar to Tlingit-Haida by Disability Age Under 5
In terms of disability age under 5, the demographic groups most similar to Tlingit-Haida are Scandinavian (1.5%, a difference of 0.050%), Estonian (1.5%, a difference of 0.23%), Croatian (1.5%, a difference of 0.25%), Hungarian (1.5%, a difference of 0.37%), and Czech (1.5%, a difference of 0.50%).
| Demographics | Rating | Rank | Disability Age Under 5 |
| Danes | 0.0 /100 | #279 | Tragic 1.5% |
| British | 0.0 /100 | #280 | Tragic 1.5% |
| Czechoslovakians | 0.0 /100 | #281 | Tragic 1.5% |
| Cheyenne | 0.0 /100 | #282 | Tragic 1.5% |
| Delaware | 0.0 /100 | #283 | Tragic 1.5% |
| Europeans | 0.0 /100 | #284 | Tragic 1.5% |
| Croatians | 0.0 /100 | #285 | Tragic 1.5% |
| Tlingit-Haida | 0.0 /100 | #286 | Tragic 1.5% |
| Scandinavians | 0.0 /100 | #287 | Tragic 1.5% |
| Estonians | 0.0 /100 | #288 | Tragic 1.5% |
| Hungarians | 0.0 /100 | #289 | Tragic 1.5% |
| Czechs | 0.0 /100 | #290 | Tragic 1.5% |
| Northern Europeans | 0.0 /100 | #291 | Tragic 1.6% |
| Italians | 0.0 /100 | #292 | Tragic 1.6% |
| Lithuanians | 0.0 /100 | #293 | Tragic 1.6% |
Demographics Similar to South Africans by Disability Age Under 5
In terms of disability age under 5, the demographic groups most similar to South Africans are Israeli (1.1%, a difference of 0.030%), Immigrants from Belize (1.1%, a difference of 0.040%), Immigrants from Indonesia (1.1%, a difference of 0.10%), Immigrants from Ecuador (1.1%, a difference of 0.11%), and Trinidadian and Tobagonian (1.1%, a difference of 0.17%).
| Demographics | Rating | Rank | Disability Age Under 5 |
| Immigrants | Ethiopia | 99.2 /100 | #61 | Exceptional 1.1% |
| Immigrants | Switzerland | 99.2 /100 | #62 | Exceptional 1.1% |
| Immigrants | Vietnam | 99.1 /100 | #63 | Exceptional 1.1% |
| Egyptians | 98.9 /100 | #64 | Exceptional 1.1% |
| Immigrants | Korea | 98.8 /100 | #65 | Exceptional 1.1% |
| Immigrants | Indonesia | 98.7 /100 | #66 | Exceptional 1.1% |
| Immigrants | Belize | 98.7 /100 | #67 | Exceptional 1.1% |
| South Africans | 98.7 /100 | #68 | Exceptional 1.1% |
| Israelis | 98.7 /100 | #69 | Exceptional 1.1% |
| Immigrants | Ecuador | 98.6 /100 | #70 | Exceptional 1.1% |
| Trinidadians and Tobagonians | 98.6 /100 | #71 | Exceptional 1.1% |
| Burmese | 98.5 /100 | #72 | Exceptional 1.1% |
| Immigrants | Sri Lanka | 98.5 /100 | #73 | Exceptional 1.1% |
| Jordanians | 98.5 /100 | #74 | Exceptional 1.1% |
| Immigrants | Pakistan | 98.4 /100 | #75 | Exceptional 1.1% |