Tlingit-Haida vs Immigrants from Oceania Female Disability
COMPARE
Tlingit-Haida
Immigrants from Oceania
Female Disability
Female Disability Comparison
Tlingit-Haida
Immigrants from Oceania
13.2%
FEMALE DISABILITY
0.0/ 100
METRIC RATING
289th/ 347
METRIC RANK
12.1%
FEMALE DISABILITY
61.8/ 100
METRIC RATING
165th/ 347
METRIC RANK
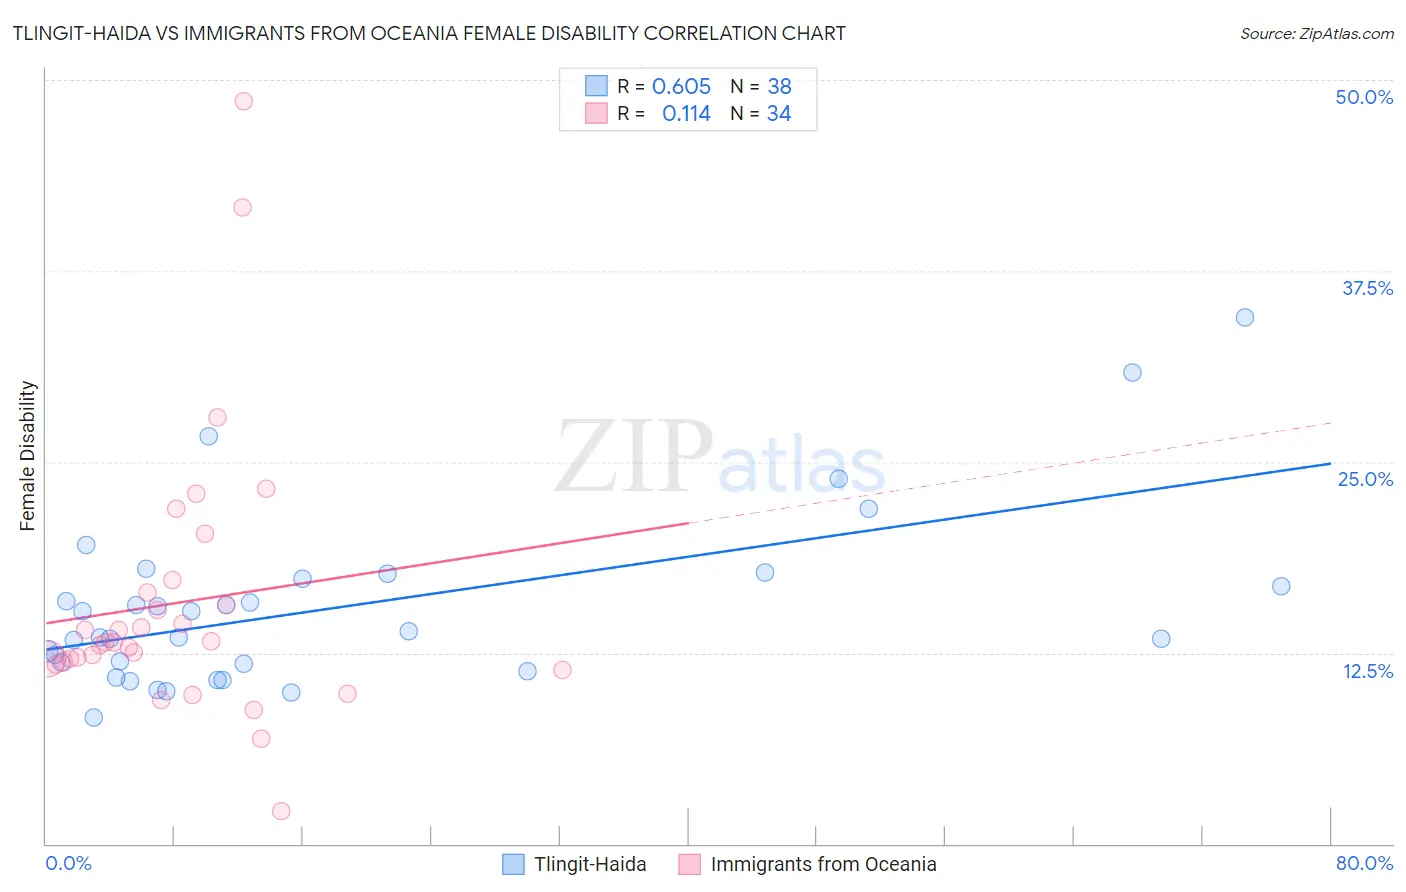
Tlingit-Haida vs Immigrants from Oceania Female Disability Correlation Chart
The statistical analysis conducted on geographies consisting of 60,854,290 people shows a significant positive correlation between the proportion of Tlingit-Haida and percentage of females with a disability in the United States with a correlation coefficient (R) of 0.605 and weighted average of 13.2%. Similarly, the statistical analysis conducted on geographies consisting of 305,480,731 people shows a poor positive correlation between the proportion of Immigrants from Oceania and percentage of females with a disability in the United States with a correlation coefficient (R) of 0.114 and weighted average of 12.1%, a difference of 8.8%.
Female Disability Correlation Summary
| Measurement | Tlingit-Haida | Immigrants from Oceania |
| Minimum | 8.2% | 2.2% |
| Maximum | 34.5% | 48.6% |
| Range | 26.2% | 46.4% |
| Mean | 15.5% | 15.8% |
| Median | 13.7% | 13.2% |
| Interquartile 25% (IQ1) | 11.8% | 11.9% |
| Interquartile 75% (IQ3) | 17.3% | 16.4% |
| Interquartile Range (IQR) | 5.5% | 4.5% |
| Standard Deviation (Sample) | 5.7% | 9.0% |
| Standard Deviation (Population) | 5.6% | 8.8% |
Similar Demographics by Female Disability
Demographics Similar to Tlingit-Haida by Female Disability
In terms of female disability, the demographic groups most similar to Tlingit-Haida are Immigrants from Yemen (13.2%, a difference of 0.0%), Shoshone (13.2%, a difference of 0.060%), White/Caucasian (13.2%, a difference of 0.17%), Yakama (13.2%, a difference of 0.23%), and Yaqui (13.2%, a difference of 0.27%).
| Demographics | Rating | Rank | Female Disability |
| Welsh | 0.0 /100 | #282 | Tragic 13.1% |
| English | 0.0 /100 | #283 | Tragic 13.1% |
| Hmong | 0.0 /100 | #284 | Tragic 13.1% |
| Bangladeshis | 0.0 /100 | #285 | Tragic 13.1% |
| Fijians | 0.0 /100 | #286 | Tragic 13.1% |
| Yaqui | 0.0 /100 | #287 | Tragic 13.2% |
| Whites/Caucasians | 0.0 /100 | #288 | Tragic 13.2% |
| Tlingit-Haida | 0.0 /100 | #289 | Tragic 13.2% |
| Immigrants | Yemen | 0.0 /100 | #290 | Tragic 13.2% |
| Shoshone | 0.0 /100 | #291 | Tragic 13.2% |
| Yakama | 0.0 /100 | #292 | Tragic 13.2% |
| Marshallese | 0.0 /100 | #293 | Tragic 13.3% |
| Celtics | 0.0 /100 | #294 | Tragic 13.3% |
| French | 0.0 /100 | #295 | Tragic 13.3% |
| Nepalese | 0.0 /100 | #296 | Tragic 13.3% |
Demographics Similar to Immigrants from Oceania by Female Disability
In terms of female disability, the demographic groups most similar to Immigrants from Oceania are Czech (12.1%, a difference of 0.070%), Guatemalan (12.1%, a difference of 0.080%), Lithuanian (12.2%, a difference of 0.090%), Immigrants from Ukraine (12.1%, a difference of 0.10%), and Guyanese (12.1%, a difference of 0.11%).
| Demographics | Rating | Rank | Female Disability |
| Immigrants | Middle Africa | 72.4 /100 | #158 | Good 12.1% |
| Immigrants | Central America | 67.7 /100 | #159 | Good 12.1% |
| Immigrants | Guatemala | 66.0 /100 | #160 | Good 12.1% |
| Guyanese | 64.7 /100 | #161 | Good 12.1% |
| Immigrants | Ukraine | 64.3 /100 | #162 | Good 12.1% |
| Guatemalans | 63.8 /100 | #163 | Good 12.1% |
| Czechs | 63.6 /100 | #164 | Good 12.1% |
| Immigrants | Oceania | 61.8 /100 | #165 | Good 12.1% |
| Lithuanians | 59.5 /100 | #166 | Average 12.2% |
| Immigrants | Latin America | 59.0 /100 | #167 | Average 12.2% |
| Immigrants | Haiti | 58.8 /100 | #168 | Average 12.2% |
| Lebanese | 58.1 /100 | #169 | Average 12.2% |
| Maltese | 57.0 /100 | #170 | Average 12.2% |
| Immigrants | Southern Europe | 56.3 /100 | #171 | Average 12.2% |
| Haitians | 51.9 /100 | #172 | Average 12.2% |