Tlingit-Haida vs Immigrants from Oceania No Schooling Completed
COMPARE
Tlingit-Haida
Immigrants from Oceania
No Schooling Completed
No Schooling Completed Comparison
Tlingit-Haida
Immigrants from Oceania
1.5%
NO SCHOOLING COMPLETED
100.0/ 100
METRIC RATING
15th/ 347
METRIC RANK
2.2%
NO SCHOOLING COMPLETED
10.2/ 100
METRIC RATING
209th/ 347
METRIC RANK
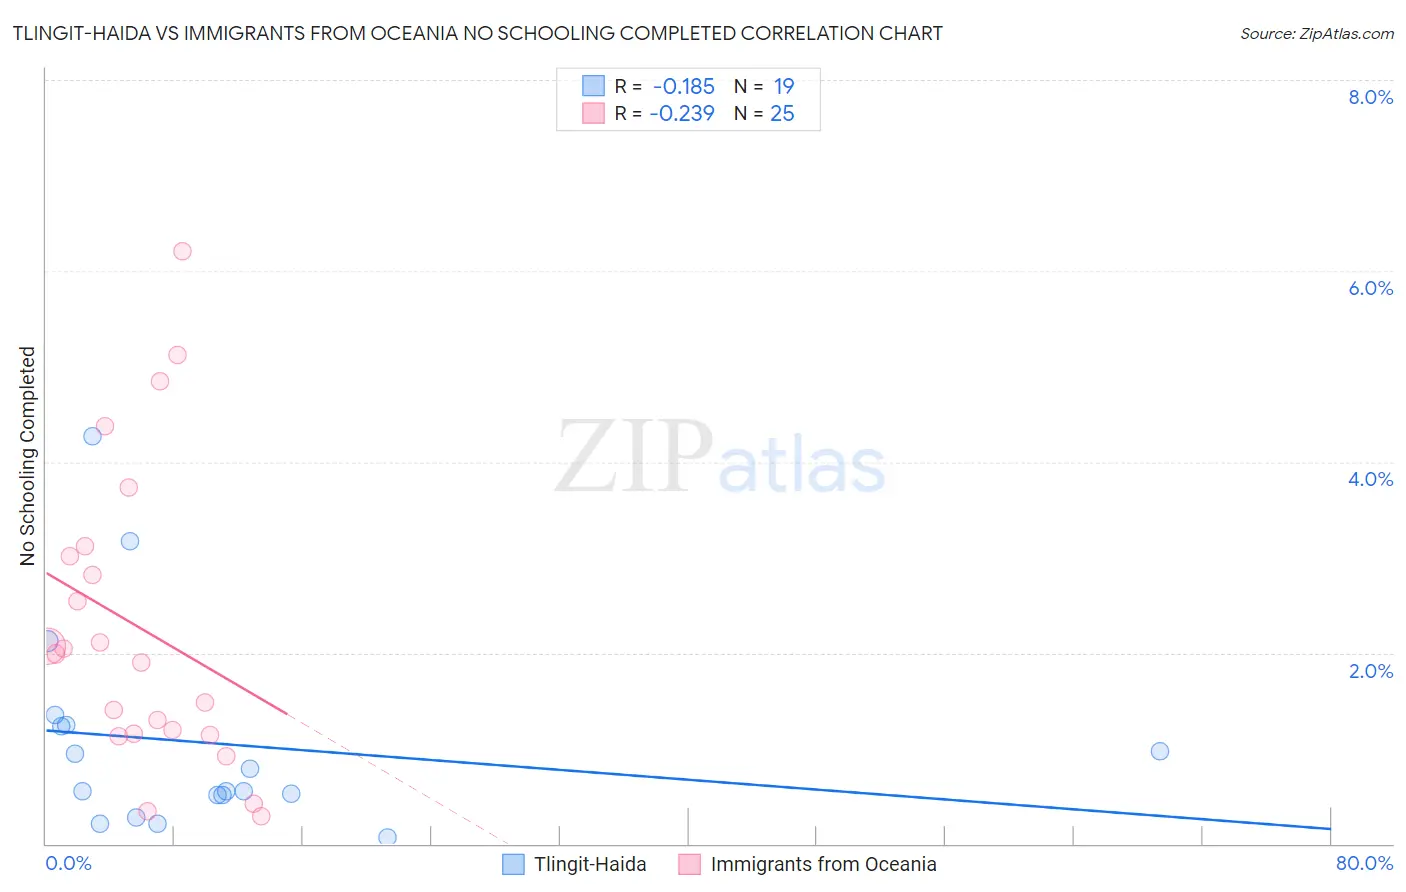
Tlingit-Haida vs Immigrants from Oceania No Schooling Completed Correlation Chart
The statistical analysis conducted on geographies consisting of 60,521,885 people shows a poor negative correlation between the proportion of Tlingit-Haida and percentage of population with no schooling in the United States with a correlation coefficient (R) of -0.185 and weighted average of 1.5%. Similarly, the statistical analysis conducted on geographies consisting of 302,492,399 people shows a weak negative correlation between the proportion of Immigrants from Oceania and percentage of population with no schooling in the United States with a correlation coefficient (R) of -0.239 and weighted average of 2.2%, a difference of 54.5%.
No Schooling Completed Correlation Summary
| Measurement | Tlingit-Haida | Immigrants from Oceania |
| Minimum | 0.064% | 0.28% |
| Maximum | 4.3% | 6.2% |
| Range | 4.2% | 5.9% |
| Mean | 1.1% | 2.3% |
| Median | 0.55% | 2.0% |
| Interquartile 25% (IQ1) | 0.51% | 1.1% |
| Interquartile 75% (IQ3) | 1.2% | 3.1% |
| Interquartile Range (IQR) | 0.74% | 1.9% |
| Standard Deviation (Sample) | 1.1% | 1.6% |
| Standard Deviation (Population) | 1.0% | 1.5% |
Similar Demographics by No Schooling Completed
Demographics Similar to Tlingit-Haida by No Schooling Completed
In terms of no schooling completed, the demographic groups most similar to Tlingit-Haida are Scotch-Irish (1.5%, a difference of 0.060%), Finnish (1.5%, a difference of 0.52%), Croatian (1.5%, a difference of 0.53%), Danish (1.5%, a difference of 0.84%), and Alaskan Athabascan (1.5%, a difference of 0.94%).
| Demographics | Rating | Rank | No Schooling Completed |
| Swedes | 100.0 /100 | #8 | Exceptional 1.4% |
| Scottish | 100.0 /100 | #9 | Exceptional 1.4% |
| Dutch | 100.0 /100 | #10 | Exceptional 1.4% |
| Lithuanians | 100.0 /100 | #11 | Exceptional 1.4% |
| Irish | 100.0 /100 | #12 | Exceptional 1.4% |
| Poles | 100.0 /100 | #13 | Exceptional 1.4% |
| Scotch-Irish | 100.0 /100 | #14 | Exceptional 1.5% |
| Tlingit-Haida | 100.0 /100 | #15 | Exceptional 1.5% |
| Finns | 100.0 /100 | #16 | Exceptional 1.5% |
| Croatians | 100.0 /100 | #17 | Exceptional 1.5% |
| Danes | 100.0 /100 | #18 | Exceptional 1.5% |
| Alaskan Athabascans | 100.0 /100 | #19 | Exceptional 1.5% |
| Welsh | 100.0 /100 | #20 | Exceptional 1.5% |
| Chinese | 100.0 /100 | #21 | Exceptional 1.5% |
| Alaska Natives | 100.0 /100 | #22 | Exceptional 1.5% |
Demographics Similar to Immigrants from Oceania by No Schooling Completed
In terms of no schooling completed, the demographic groups most similar to Immigrants from Oceania are Native/Alaskan (2.2%, a difference of 0.070%), Uruguayan (2.2%, a difference of 0.25%), South American Indian (2.2%, a difference of 0.26%), Bahamian (2.2%, a difference of 0.44%), and Immigrants from Bahamas (2.2%, a difference of 0.45%).
| Demographics | Rating | Rank | No Schooling Completed |
| Moroccans | 13.7 /100 | #202 | Poor 2.2% |
| Laotians | 13.3 /100 | #203 | Poor 2.2% |
| Hopi | 12.9 /100 | #204 | Poor 2.2% |
| Immigrants | Bahamas | 11.6 /100 | #205 | Poor 2.2% |
| Bahamians | 11.6 /100 | #206 | Poor 2.2% |
| South American Indians | 11.0 /100 | #207 | Poor 2.2% |
| Uruguayans | 11.0 /100 | #208 | Poor 2.2% |
| Immigrants | Oceania | 10.2 /100 | #209 | Poor 2.2% |
| Natives/Alaskans | 10.0 /100 | #210 | Tragic 2.2% |
| Immigrants | Panama | 8.8 /100 | #211 | Tragic 2.3% |
| Immigrants | Morocco | 8.7 /100 | #212 | Tragic 2.3% |
| Ute | 8.2 /100 | #213 | Tragic 2.3% |
| Samoans | 8.2 /100 | #214 | Tragic 2.3% |
| Immigrants | Zaire | 7.2 /100 | #215 | Tragic 2.3% |
| Tongans | 6.8 /100 | #216 | Tragic 2.3% |