Tlingit-Haida vs Immigrants from Oceania Professional Degree
COMPARE
Tlingit-Haida
Immigrants from Oceania
Professional Degree
Professional Degree Comparison
Tlingit-Haida
Immigrants from Oceania
4.0%
PROFESSIONAL DEGREE
6.9/ 100
METRIC RATING
225th/ 347
METRIC RANK
4.6%
PROFESSIONAL DEGREE
73.4/ 100
METRIC RATING
150th/ 347
METRIC RANK
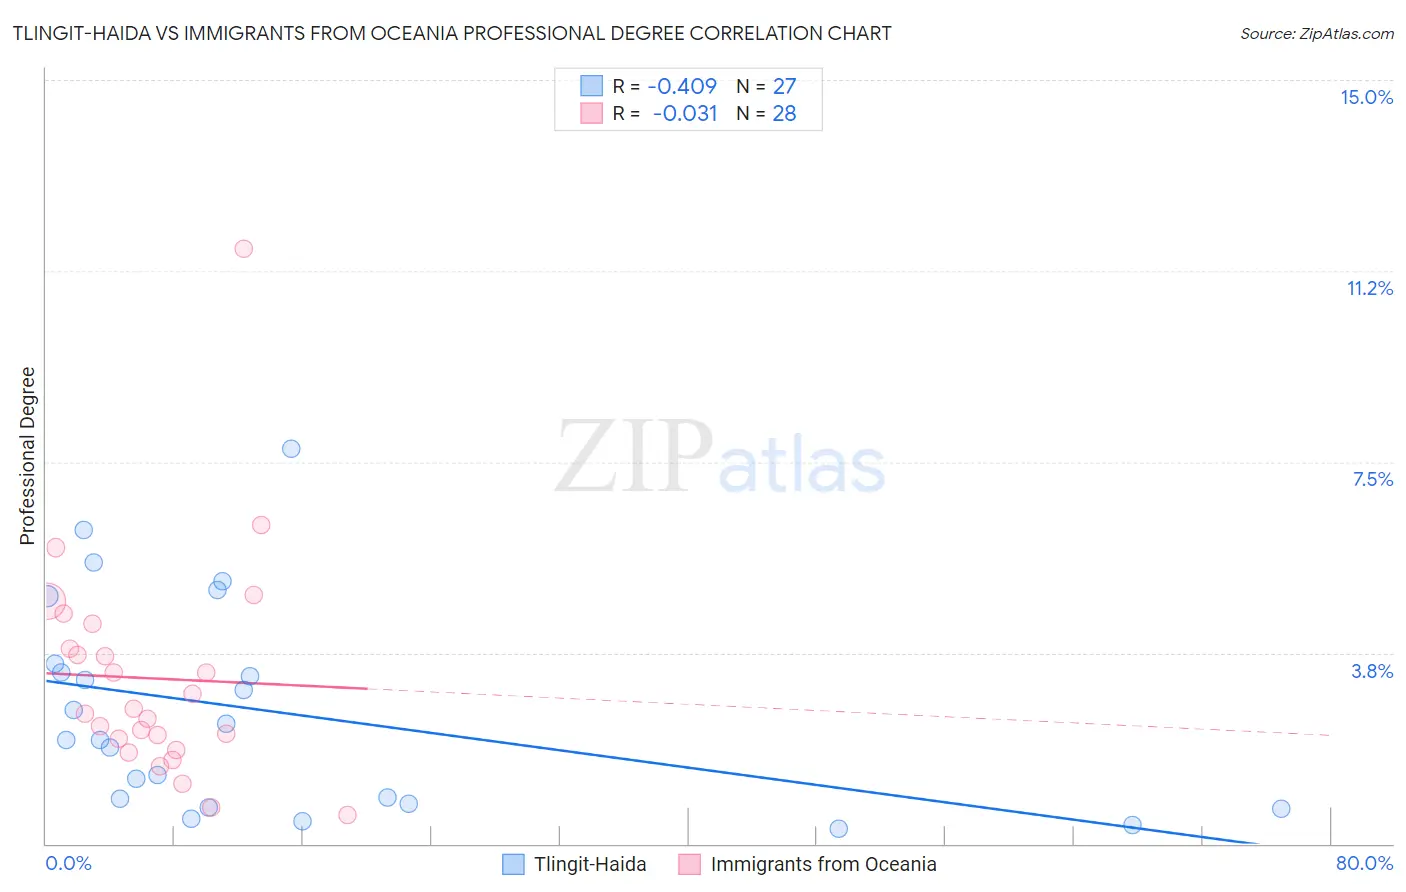
Tlingit-Haida vs Immigrants from Oceania Professional Degree Correlation Chart
The statistical analysis conducted on geographies consisting of 60,804,228 people shows a moderate negative correlation between the proportion of Tlingit-Haida and percentage of population with at least professional degree education in the United States with a correlation coefficient (R) of -0.409 and weighted average of 4.0%. Similarly, the statistical analysis conducted on geographies consisting of 305,056,134 people shows no correlation between the proportion of Immigrants from Oceania and percentage of population with at least professional degree education in the United States with a correlation coefficient (R) of -0.031 and weighted average of 4.6%, a difference of 14.5%.
Professional Degree Correlation Summary
| Measurement | Tlingit-Haida | Immigrants from Oceania |
| Minimum | 0.29% | 0.57% |
| Maximum | 7.8% | 11.7% |
| Range | 7.5% | 11.1% |
| Mean | 2.6% | 3.2% |
| Median | 2.0% | 2.6% |
| Interquartile 25% (IQ1) | 0.79% | 2.0% |
| Interquartile 75% (IQ3) | 3.5% | 4.1% |
| Interquartile Range (IQR) | 2.7% | 2.1% |
| Standard Deviation (Sample) | 2.0% | 2.2% |
| Standard Deviation (Population) | 2.0% | 2.2% |
Similar Demographics by Professional Degree
Demographics Similar to Tlingit-Haida by Professional Degree
In terms of professional degree, the demographic groups most similar to Tlingit-Haida are Trinidadian and Tobagonian (4.0%, a difference of 0.13%), Immigrants from Bosnia and Herzegovina (4.0%, a difference of 0.27%), Immigrants from Western Africa (4.0%, a difference of 0.35%), German Russian (4.0%, a difference of 0.55%), and French Canadian (4.0%, a difference of 0.60%).
| Demographics | Rating | Rank | Professional Degree |
| Dutch | 9.0 /100 | #218 | Tragic 4.0% |
| Immigrants | South Eastern Asia | 8.9 /100 | #219 | Tragic 4.0% |
| Ute | 8.2 /100 | #220 | Tragic 4.0% |
| French Canadians | 8.0 /100 | #221 | Tragic 4.0% |
| Immigrants | Western Africa | 7.5 /100 | #222 | Tragic 4.0% |
| Immigrants | Bosnia and Herzegovina | 7.4 /100 | #223 | Tragic 4.0% |
| Trinidadians and Tobagonians | 7.1 /100 | #224 | Tragic 4.0% |
| Tlingit-Haida | 6.9 /100 | #225 | Tragic 4.0% |
| German Russians | 6.1 /100 | #226 | Tragic 4.0% |
| Cubans | 5.9 /100 | #227 | Tragic 4.0% |
| Immigrants | West Indies | 5.6 /100 | #228 | Tragic 4.0% |
| Immigrants | Burma/Myanmar | 5.4 /100 | #229 | Tragic 3.9% |
| Nicaraguans | 5.1 /100 | #230 | Tragic 3.9% |
| Ecuadorians | 4.6 /100 | #231 | Tragic 3.9% |
| Cree | 4.3 /100 | #232 | Tragic 3.9% |
Demographics Similar to Immigrants from Oceania by Professional Degree
In terms of professional degree, the demographic groups most similar to Immigrants from Oceania are Polish (4.6%, a difference of 0.14%), Immigrants from Africa (4.6%, a difference of 0.15%), Immigrants from Uruguay (4.6%, a difference of 0.16%), Scottish (4.6%, a difference of 0.28%), and Senegalese (4.6%, a difference of 0.35%).
| Demographics | Rating | Rank | Professional Degree |
| Hungarians | 80.8 /100 | #143 | Excellent 4.6% |
| Immigrants | South America | 80.5 /100 | #144 | Excellent 4.6% |
| Uruguayans | 80.2 /100 | #145 | Excellent 4.6% |
| Luxembourgers | 78.7 /100 | #146 | Good 4.6% |
| Colombians | 77.7 /100 | #147 | Good 4.6% |
| Slovenes | 76.1 /100 | #148 | Good 4.6% |
| Senegalese | 75.3 /100 | #149 | Good 4.6% |
| Immigrants | Oceania | 73.4 /100 | #150 | Good 4.6% |
| Poles | 72.6 /100 | #151 | Good 4.6% |
| Immigrants | Africa | 72.5 /100 | #152 | Good 4.6% |
| Immigrants | Uruguay | 72.5 /100 | #153 | Good 4.6% |
| Scottish | 71.8 /100 | #154 | Good 4.6% |
| Slavs | 70.8 /100 | #155 | Good 4.5% |
| Swedes | 69.9 /100 | #156 | Good 4.5% |
| Iraqis | 69.8 /100 | #157 | Good 4.5% |