Tlingit-Haida vs Belizean Female Disability
COMPARE
Tlingit-Haida
Belizean
Female Disability
Female Disability Comparison
Tlingit-Haida
Belizeans
13.2%
FEMALE DISABILITY
0.0/ 100
METRIC RATING
289th/ 347
METRIC RANK
12.5%
FEMALE DISABILITY
9.3/ 100
METRIC RATING
224th/ 347
METRIC RANK
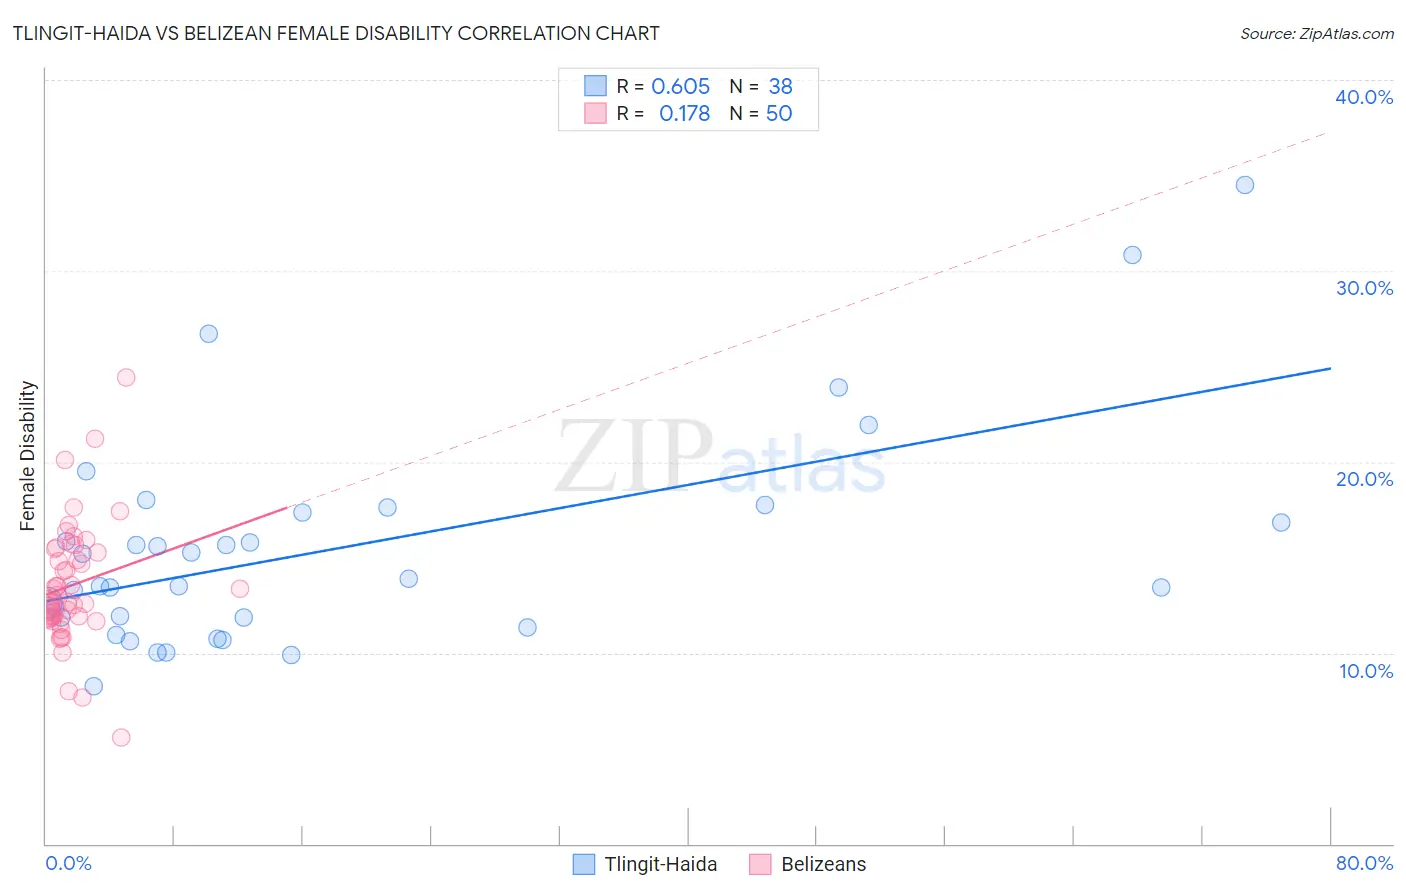
Tlingit-Haida vs Belizean Female Disability Correlation Chart
The statistical analysis conducted on geographies consisting of 60,854,290 people shows a significant positive correlation between the proportion of Tlingit-Haida and percentage of females with a disability in the United States with a correlation coefficient (R) of 0.605 and weighted average of 13.2%. Similarly, the statistical analysis conducted on geographies consisting of 144,186,476 people shows a poor positive correlation between the proportion of Belizeans and percentage of females with a disability in the United States with a correlation coefficient (R) of 0.178 and weighted average of 12.5%, a difference of 6.0%.
Female Disability Correlation Summary
| Measurement | Tlingit-Haida | Belizean |
| Minimum | 8.2% | 5.5% |
| Maximum | 34.5% | 24.4% |
| Range | 26.2% | 18.9% |
| Mean | 15.5% | 13.5% |
| Median | 13.7% | 12.8% |
| Interquartile 25% (IQ1) | 11.8% | 11.8% |
| Interquartile 75% (IQ3) | 17.3% | 15.4% |
| Interquartile Range (IQR) | 5.5% | 3.6% |
| Standard Deviation (Sample) | 5.7% | 3.2% |
| Standard Deviation (Population) | 5.6% | 3.2% |
Similar Demographics by Female Disability
Demographics Similar to Tlingit-Haida by Female Disability
In terms of female disability, the demographic groups most similar to Tlingit-Haida are Immigrants from Yemen (13.2%, a difference of 0.0%), Shoshone (13.2%, a difference of 0.060%), White/Caucasian (13.2%, a difference of 0.17%), Yakama (13.2%, a difference of 0.23%), and Yaqui (13.2%, a difference of 0.27%).
| Demographics | Rating | Rank | Female Disability |
| Welsh | 0.0 /100 | #282 | Tragic 13.1% |
| English | 0.0 /100 | #283 | Tragic 13.1% |
| Hmong | 0.0 /100 | #284 | Tragic 13.1% |
| Bangladeshis | 0.0 /100 | #285 | Tragic 13.1% |
| Fijians | 0.0 /100 | #286 | Tragic 13.1% |
| Yaqui | 0.0 /100 | #287 | Tragic 13.2% |
| Whites/Caucasians | 0.0 /100 | #288 | Tragic 13.2% |
| Tlingit-Haida | 0.0 /100 | #289 | Tragic 13.2% |
| Immigrants | Yemen | 0.0 /100 | #290 | Tragic 13.2% |
| Shoshone | 0.0 /100 | #291 | Tragic 13.2% |
| Yakama | 0.0 /100 | #292 | Tragic 13.2% |
| Marshallese | 0.0 /100 | #293 | Tragic 13.3% |
| Celtics | 0.0 /100 | #294 | Tragic 13.3% |
| French | 0.0 /100 | #295 | Tragic 13.3% |
| Nepalese | 0.0 /100 | #296 | Tragic 13.3% |
Demographics Similar to Belizeans by Female Disability
In terms of female disability, the demographic groups most similar to Belizeans are Guamanian/Chamorro (12.5%, a difference of 0.020%), Polish (12.5%, a difference of 0.10%), Italian (12.4%, a difference of 0.14%), Hispanic or Latino (12.5%, a difference of 0.15%), and Native Hawaiian (12.4%, a difference of 0.16%).
| Demographics | Rating | Rank | Female Disability |
| British | 12.7 /100 | #217 | Poor 12.4% |
| Immigrants | Bahamas | 12.5 /100 | #218 | Poor 12.4% |
| Europeans | 12.1 /100 | #219 | Poor 12.4% |
| Bahamians | 11.1 /100 | #220 | Poor 12.4% |
| Native Hawaiians | 10.8 /100 | #221 | Poor 12.4% |
| Italians | 10.7 /100 | #222 | Poor 12.4% |
| Guamanians/Chamorros | 9.5 /100 | #223 | Tragic 12.5% |
| Belizeans | 9.3 /100 | #224 | Tragic 12.5% |
| Poles | 8.4 /100 | #225 | Tragic 12.5% |
| Hispanics or Latinos | 8.0 /100 | #226 | Tragic 12.5% |
| Assyrians/Chaldeans/Syriacs | 8.0 /100 | #227 | Tragic 12.5% |
| Immigrants | Cambodia | 7.8 /100 | #228 | Tragic 12.5% |
| Hungarians | 7.2 /100 | #229 | Tragic 12.5% |
| Immigrants | Belize | 7.0 /100 | #230 | Tragic 12.5% |
| Belgians | 6.5 /100 | #231 | Tragic 12.5% |