Tlingit-Haida vs Subsaharan African Female Disability
COMPARE
Tlingit-Haida
Subsaharan African
Female Disability
Female Disability Comparison
Tlingit-Haida
Sub-Saharan Africans
13.2%
FEMALE DISABILITY
0.0/ 100
METRIC RATING
289th/ 347
METRIC RANK
12.7%
FEMALE DISABILITY
1.0/ 100
METRIC RATING
260th/ 347
METRIC RANK
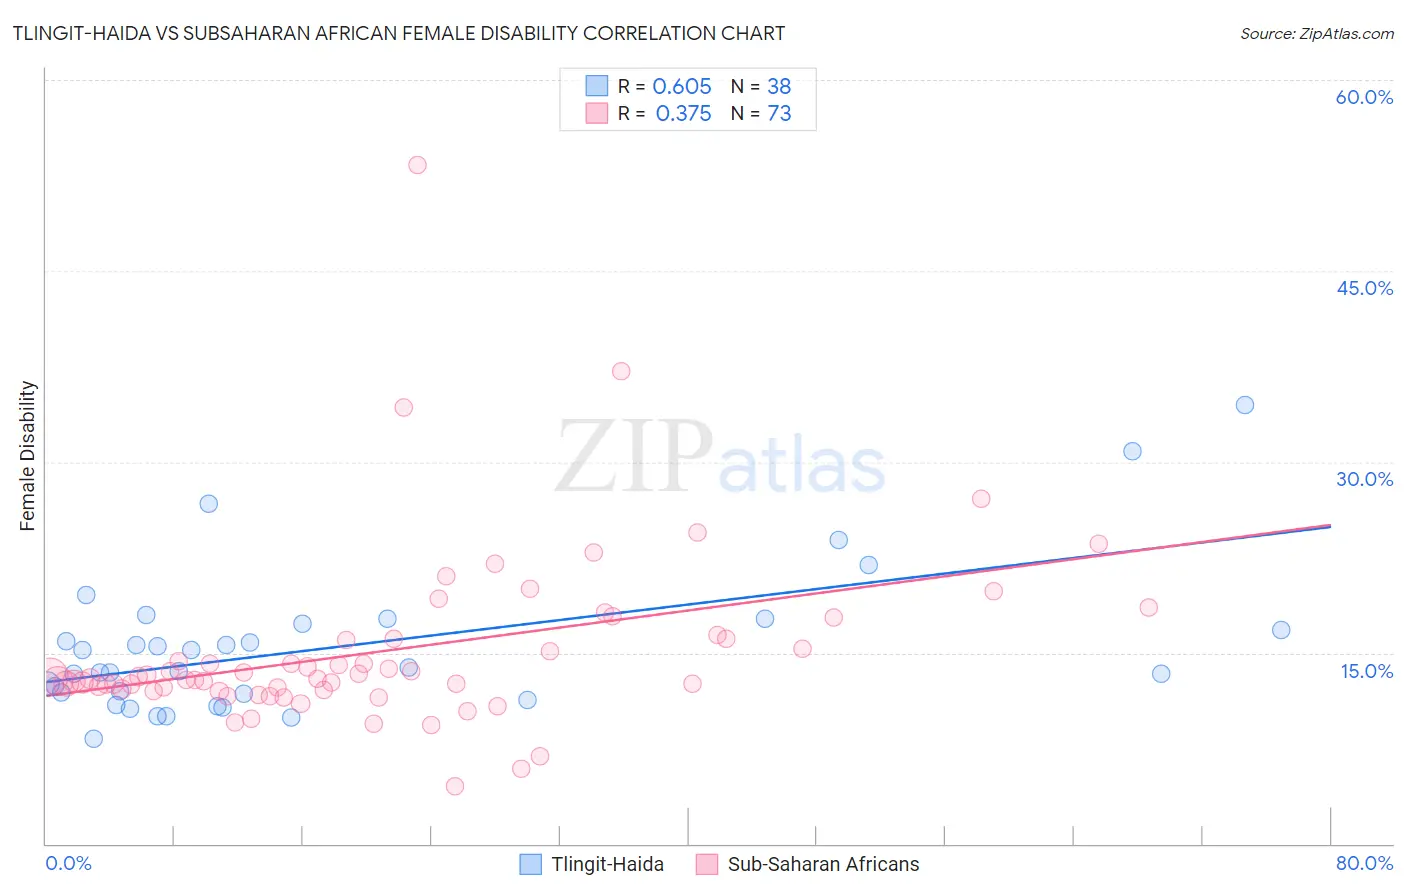
Tlingit-Haida vs Subsaharan African Female Disability Correlation Chart
The statistical analysis conducted on geographies consisting of 60,854,290 people shows a significant positive correlation between the proportion of Tlingit-Haida and percentage of females with a disability in the United States with a correlation coefficient (R) of 0.605 and weighted average of 13.2%. Similarly, the statistical analysis conducted on geographies consisting of 508,044,435 people shows a mild positive correlation between the proportion of Sub-Saharan Africans and percentage of females with a disability in the United States with a correlation coefficient (R) of 0.375 and weighted average of 12.7%, a difference of 3.8%.
Female Disability Correlation Summary
| Measurement | Tlingit-Haida | Subsaharan African |
| Minimum | 8.2% | 4.5% |
| Maximum | 34.5% | 53.3% |
| Range | 26.2% | 48.8% |
| Mean | 15.5% | 15.1% |
| Median | 13.7% | 12.9% |
| Interquartile 25% (IQ1) | 11.8% | 12.1% |
| Interquartile 75% (IQ3) | 17.3% | 16.1% |
| Interquartile Range (IQR) | 5.5% | 4.0% |
| Standard Deviation (Sample) | 5.7% | 7.0% |
| Standard Deviation (Population) | 5.6% | 7.0% |
Similar Demographics by Female Disability
Demographics Similar to Tlingit-Haida by Female Disability
In terms of female disability, the demographic groups most similar to Tlingit-Haida are Immigrants from Yemen (13.2%, a difference of 0.0%), Shoshone (13.2%, a difference of 0.060%), White/Caucasian (13.2%, a difference of 0.17%), Yakama (13.2%, a difference of 0.23%), and Yaqui (13.2%, a difference of 0.27%).
| Demographics | Rating | Rank | Female Disability |
| Welsh | 0.0 /100 | #282 | Tragic 13.1% |
| English | 0.0 /100 | #283 | Tragic 13.1% |
| Hmong | 0.0 /100 | #284 | Tragic 13.1% |
| Bangladeshis | 0.0 /100 | #285 | Tragic 13.1% |
| Fijians | 0.0 /100 | #286 | Tragic 13.1% |
| Yaqui | 0.0 /100 | #287 | Tragic 13.2% |
| Whites/Caucasians | 0.0 /100 | #288 | Tragic 13.2% |
| Tlingit-Haida | 0.0 /100 | #289 | Tragic 13.2% |
| Immigrants | Yemen | 0.0 /100 | #290 | Tragic 13.2% |
| Shoshone | 0.0 /100 | #291 | Tragic 13.2% |
| Yakama | 0.0 /100 | #292 | Tragic 13.2% |
| Marshallese | 0.0 /100 | #293 | Tragic 13.3% |
| Celtics | 0.0 /100 | #294 | Tragic 13.3% |
| French | 0.0 /100 | #295 | Tragic 13.3% |
| Nepalese | 0.0 /100 | #296 | Tragic 13.3% |
Demographics Similar to Sub-Saharan Africans by Female Disability
In terms of female disability, the demographic groups most similar to Sub-Saharan Africans are Immigrants from Armenia (12.7%, a difference of 0.010%), Bermudan (12.7%, a difference of 0.040%), Aleut (12.7%, a difference of 0.090%), Liberian (12.7%, a difference of 0.10%), and Czechoslovakian (12.7%, a difference of 0.11%).
| Demographics | Rating | Rank | Female Disability |
| Jamaicans | 1.4 /100 | #253 | Tragic 12.7% |
| Hawaiians | 1.4 /100 | #254 | Tragic 12.7% |
| Immigrants | Germany | 1.3 /100 | #255 | Tragic 12.7% |
| British West Indians | 1.2 /100 | #256 | Tragic 12.7% |
| Liberians | 1.1 /100 | #257 | Tragic 12.7% |
| Aleuts | 1.1 /100 | #258 | Tragic 12.7% |
| Immigrants | Armenia | 1.0 /100 | #259 | Tragic 12.7% |
| Sub-Saharan Africans | 1.0 /100 | #260 | Tragic 12.7% |
| Bermudans | 1.0 /100 | #261 | Tragic 12.7% |
| Czechoslovakians | 0.9 /100 | #262 | Tragic 12.7% |
| Spaniards | 0.7 /100 | #263 | Tragic 12.8% |
| Alaska Natives | 0.6 /100 | #264 | Tragic 12.8% |
| West Indians | 0.5 /100 | #265 | Tragic 12.8% |
| Finns | 0.4 /100 | #266 | Tragic 12.8% |
| Senegalese | 0.4 /100 | #267 | Tragic 12.8% |