Tlingit-Haida vs Immigrants from Senegal Female Disability
COMPARE
Tlingit-Haida
Immigrants from Senegal
Female Disability
Female Disability Comparison
Tlingit-Haida
Immigrants from Senegal
13.2%
FEMALE DISABILITY
0.0/ 100
METRIC RATING
289th/ 347
METRIC RANK
12.6%
FEMALE DISABILITY
2.5/ 100
METRIC RATING
243rd/ 347
METRIC RANK
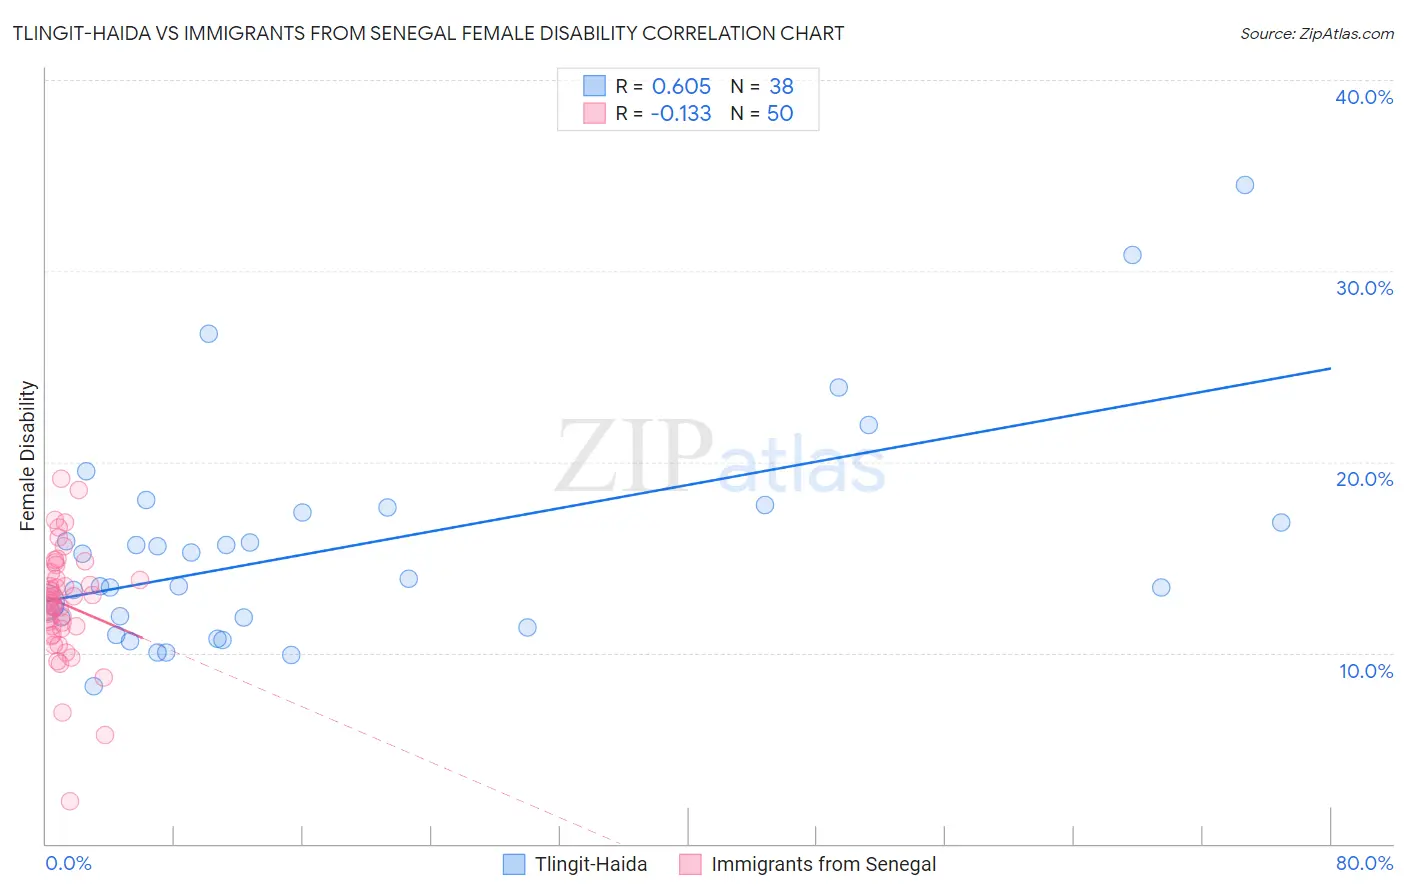
Tlingit-Haida vs Immigrants from Senegal Female Disability Correlation Chart
The statistical analysis conducted on geographies consisting of 60,854,290 people shows a significant positive correlation between the proportion of Tlingit-Haida and percentage of females with a disability in the United States with a correlation coefficient (R) of 0.605 and weighted average of 13.2%. Similarly, the statistical analysis conducted on geographies consisting of 90,125,924 people shows a poor negative correlation between the proportion of Immigrants from Senegal and percentage of females with a disability in the United States with a correlation coefficient (R) of -0.133 and weighted average of 12.6%, a difference of 4.7%.
Female Disability Correlation Summary
| Measurement | Tlingit-Haida | Immigrants from Senegal |
| Minimum | 8.2% | 2.3% |
| Maximum | 34.5% | 19.1% |
| Range | 26.2% | 16.9% |
| Mean | 15.5% | 12.6% |
| Median | 13.7% | 12.7% |
| Interquartile 25% (IQ1) | 11.8% | 11.2% |
| Interquartile 75% (IQ3) | 17.3% | 14.2% |
| Interquartile Range (IQR) | 5.5% | 2.9% |
| Standard Deviation (Sample) | 5.7% | 3.0% |
| Standard Deviation (Population) | 5.6% | 3.0% |
Similar Demographics by Female Disability
Demographics Similar to Tlingit-Haida by Female Disability
In terms of female disability, the demographic groups most similar to Tlingit-Haida are Immigrants from Yemen (13.2%, a difference of 0.0%), Shoshone (13.2%, a difference of 0.060%), White/Caucasian (13.2%, a difference of 0.17%), Yakama (13.2%, a difference of 0.23%), and Yaqui (13.2%, a difference of 0.27%).
| Demographics | Rating | Rank | Female Disability |
| Welsh | 0.0 /100 | #282 | Tragic 13.1% |
| English | 0.0 /100 | #283 | Tragic 13.1% |
| Hmong | 0.0 /100 | #284 | Tragic 13.1% |
| Bangladeshis | 0.0 /100 | #285 | Tragic 13.1% |
| Fijians | 0.0 /100 | #286 | Tragic 13.1% |
| Yaqui | 0.0 /100 | #287 | Tragic 13.2% |
| Whites/Caucasians | 0.0 /100 | #288 | Tragic 13.2% |
| Tlingit-Haida | 0.0 /100 | #289 | Tragic 13.2% |
| Immigrants | Yemen | 0.0 /100 | #290 | Tragic 13.2% |
| Shoshone | 0.0 /100 | #291 | Tragic 13.2% |
| Yakama | 0.0 /100 | #292 | Tragic 13.2% |
| Marshallese | 0.0 /100 | #293 | Tragic 13.3% |
| Celtics | 0.0 /100 | #294 | Tragic 13.3% |
| French | 0.0 /100 | #295 | Tragic 13.3% |
| Nepalese | 0.0 /100 | #296 | Tragic 13.3% |
Demographics Similar to Immigrants from Senegal by Female Disability
In terms of female disability, the demographic groups most similar to Immigrants from Senegal are Canadian (12.6%, a difference of 0.010%), Alsatian (12.6%, a difference of 0.010%), Japanese (12.6%, a difference of 0.060%), Immigrants from Jamaica (12.6%, a difference of 0.15%), and Spanish American Indian (12.6%, a difference of 0.16%).
| Demographics | Rating | Rank | Female Disability |
| Immigrants | West Indies | 4.4 /100 | #236 | Tragic 12.6% |
| Slavs | 3.8 /100 | #237 | Tragic 12.6% |
| Yugoslavians | 3.7 /100 | #238 | Tragic 12.6% |
| Barbadians | 3.6 /100 | #239 | Tragic 12.6% |
| German Russians | 3.2 /100 | #240 | Tragic 12.6% |
| Japanese | 2.7 /100 | #241 | Tragic 12.6% |
| Canadians | 2.6 /100 | #242 | Tragic 12.6% |
| Immigrants | Senegal | 2.5 /100 | #243 | Tragic 12.6% |
| Alsatians | 2.5 /100 | #244 | Tragic 12.6% |
| Immigrants | Jamaica | 2.2 /100 | #245 | Tragic 12.6% |
| Spanish American Indians | 2.1 /100 | #246 | Tragic 12.6% |
| Menominee | 2.1 /100 | #247 | Tragic 12.6% |
| Carpatho Rusyns | 2.0 /100 | #248 | Tragic 12.6% |
| Immigrants | Congo | 1.8 /100 | #249 | Tragic 12.7% |
| Slovenes | 1.7 /100 | #250 | Tragic 12.7% |