Estonian vs Immigrants from Oceania Female Disability
COMPARE
Estonian
Immigrants from Oceania
Female Disability
Female Disability Comparison
Estonians
Immigrants from Oceania
12.0%
FEMALE DISABILITY
87.8/ 100
METRIC RATING
145th/ 347
METRIC RANK
12.1%
FEMALE DISABILITY
61.8/ 100
METRIC RATING
165th/ 347
METRIC RANK
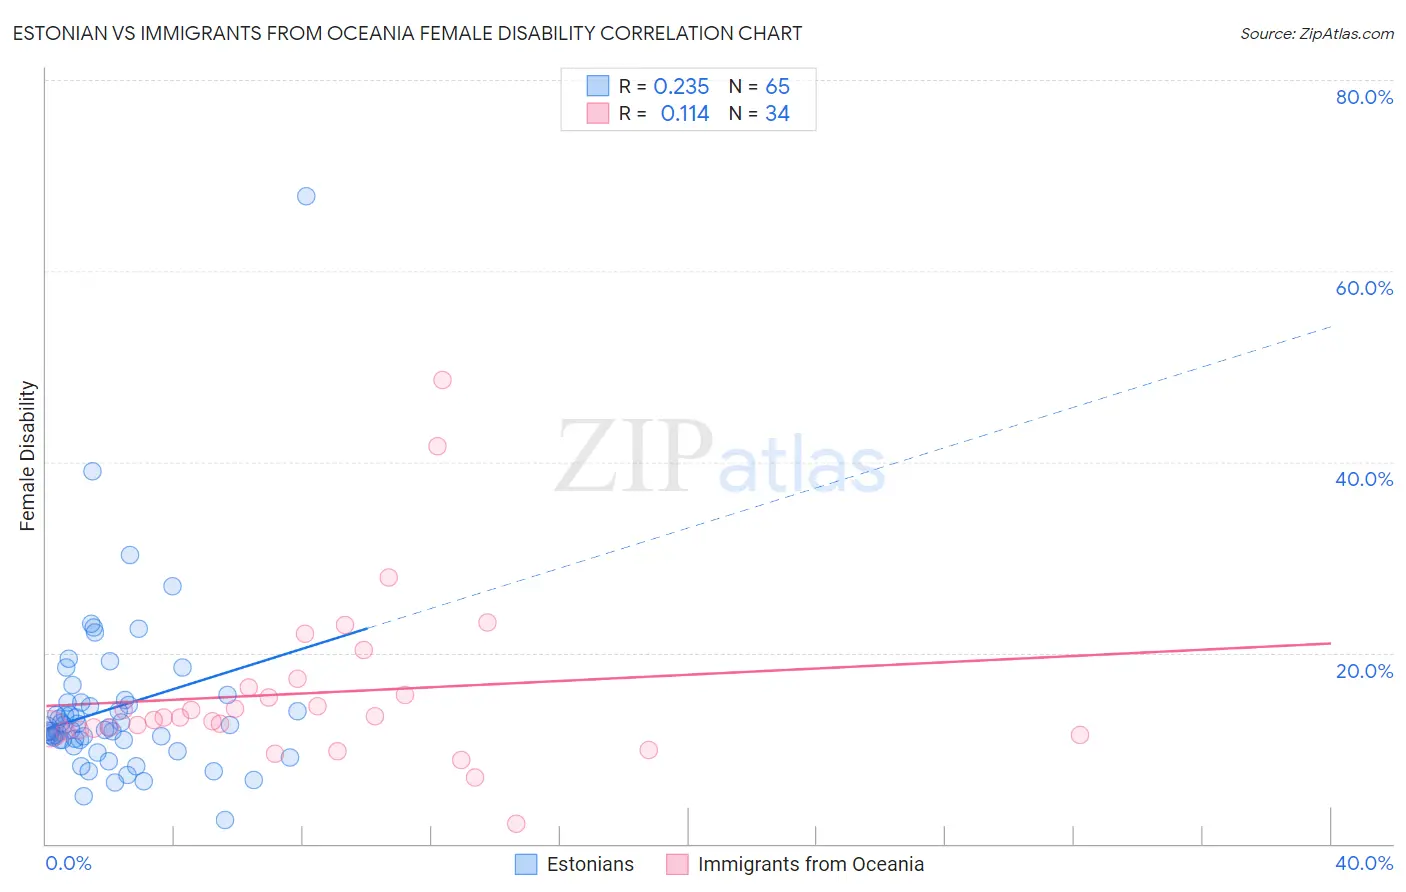
Estonian vs Immigrants from Oceania Female Disability Correlation Chart
The statistical analysis conducted on geographies consisting of 123,526,359 people shows a weak positive correlation between the proportion of Estonians and percentage of females with a disability in the United States with a correlation coefficient (R) of 0.235 and weighted average of 12.0%. Similarly, the statistical analysis conducted on geographies consisting of 305,480,731 people shows a poor positive correlation between the proportion of Immigrants from Oceania and percentage of females with a disability in the United States with a correlation coefficient (R) of 0.114 and weighted average of 12.1%, a difference of 1.4%.
Female Disability Correlation Summary
| Measurement | Estonian | Immigrants from Oceania |
| Minimum | 2.4% | 2.2% |
| Maximum | 67.8% | 48.6% |
| Range | 65.4% | 46.4% |
| Mean | 14.2% | 15.8% |
| Median | 12.1% | 13.2% |
| Interquartile 25% (IQ1) | 10.8% | 11.9% |
| Interquartile 75% (IQ3) | 14.8% | 16.4% |
| Interquartile Range (IQR) | 3.9% | 4.5% |
| Standard Deviation (Sample) | 9.0% | 9.0% |
| Standard Deviation (Population) | 8.9% | 8.8% |
Demographics Similar to Estonians and Immigrants from Oceania by Female Disability
In terms of female disability, the demographic groups most similar to Estonians are Pakistani (12.0%, a difference of 0.26%), Nigerian (12.0%, a difference of 0.30%), Immigrants from Kenya (12.0%, a difference of 0.37%), Greek (12.0%, a difference of 0.44%), and Immigrants from Moldova (12.0%, a difference of 0.48%). Similarly, the demographic groups most similar to Immigrants from Oceania are Czech (12.1%, a difference of 0.070%), Guatemalan (12.1%, a difference of 0.080%), Immigrants from Ukraine (12.1%, a difference of 0.10%), Guyanese (12.1%, a difference of 0.11%), and Immigrants from Guatemala (12.1%, a difference of 0.17%).
| Demographics | Rating | Rank | Female Disability |
| Estonians | 87.8 /100 | #145 | Excellent 12.0% |
| Pakistanis | 84.6 /100 | #146 | Excellent 12.0% |
| Nigerians | 84.0 /100 | #147 | Excellent 12.0% |
| Immigrants | Kenya | 83.1 /100 | #148 | Excellent 12.0% |
| Greeks | 82.0 /100 | #149 | Excellent 12.0% |
| Immigrants | Moldova | 81.4 /100 | #150 | Excellent 12.0% |
| Icelanders | 80.7 /100 | #151 | Excellent 12.0% |
| Immigrants | Scotland | 79.3 /100 | #152 | Good 12.0% |
| Sudanese | 79.1 /100 | #153 | Good 12.0% |
| Syrians | 76.9 /100 | #154 | Good 12.1% |
| Ghanaians | 76.6 /100 | #155 | Good 12.1% |
| Moroccans | 72.9 /100 | #156 | Good 12.1% |
| Danes | 72.5 /100 | #157 | Good 12.1% |
| Immigrants | Middle Africa | 72.4 /100 | #158 | Good 12.1% |
| Immigrants | Central America | 67.7 /100 | #159 | Good 12.1% |
| Immigrants | Guatemala | 66.0 /100 | #160 | Good 12.1% |
| Guyanese | 64.7 /100 | #161 | Good 12.1% |
| Immigrants | Ukraine | 64.3 /100 | #162 | Good 12.1% |
| Guatemalans | 63.8 /100 | #163 | Good 12.1% |
| Czechs | 63.6 /100 | #164 | Good 12.1% |
| Immigrants | Oceania | 61.8 /100 | #165 | Good 12.1% |