Tlingit-Haida vs Immigrants from the Azores Female Disability
COMPARE
Tlingit-Haida
Immigrants from the Azores
Female Disability
Female Disability Comparison
Tlingit-Haida
Immigrants from the Azores
13.2%
FEMALE DISABILITY
0.0/ 100
METRIC RATING
289th/ 347
METRIC RANK
14.9%
FEMALE DISABILITY
0.0/ 100
METRIC RATING
333rd/ 347
METRIC RANK
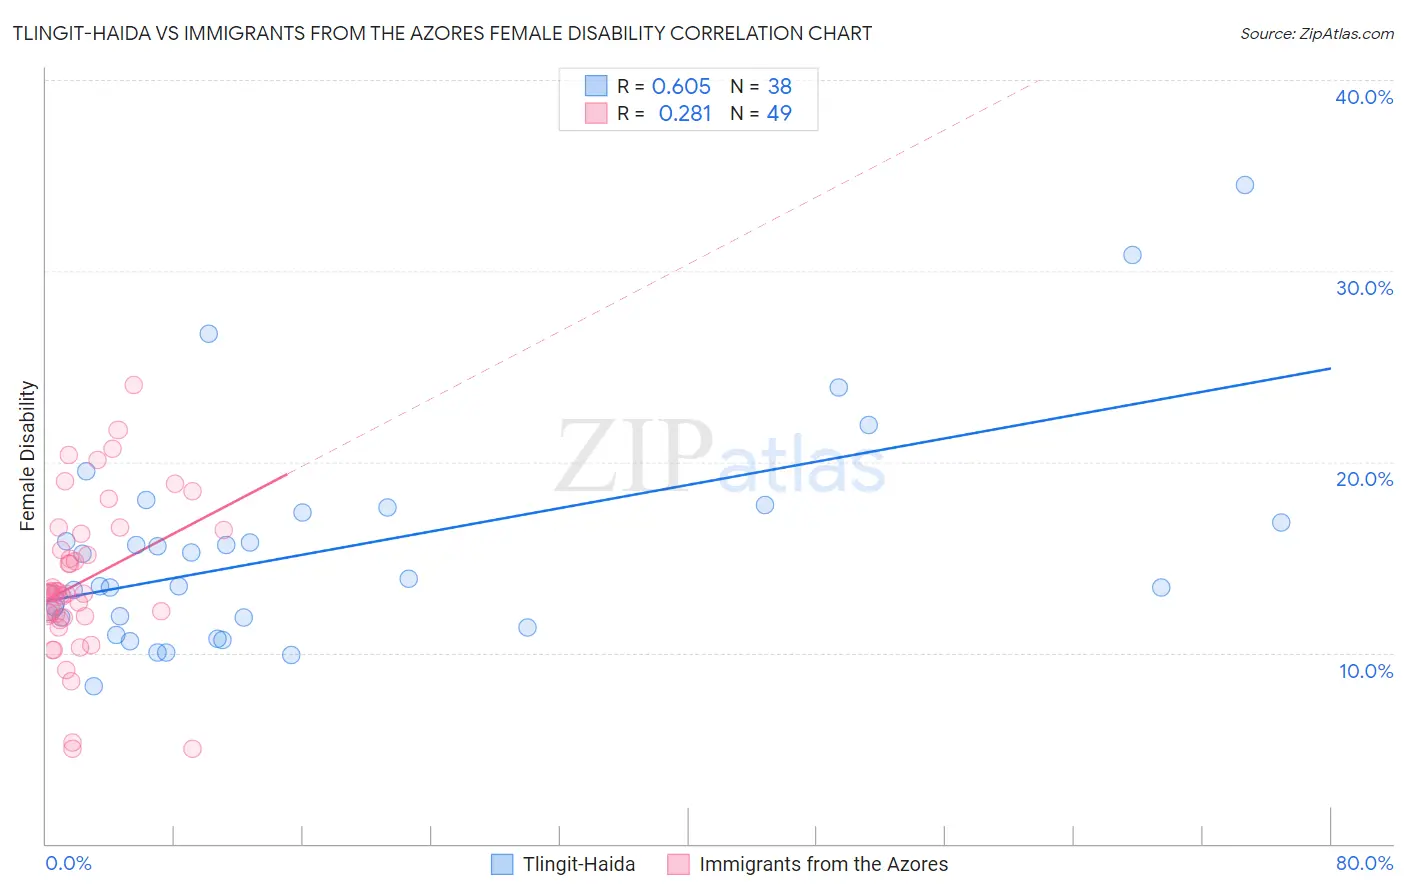
Tlingit-Haida vs Immigrants from the Azores Female Disability Correlation Chart
The statistical analysis conducted on geographies consisting of 60,854,290 people shows a significant positive correlation between the proportion of Tlingit-Haida and percentage of females with a disability in the United States with a correlation coefficient (R) of 0.605 and weighted average of 13.2%. Similarly, the statistical analysis conducted on geographies consisting of 46,257,310 people shows a weak positive correlation between the proportion of Immigrants from the Azores and percentage of females with a disability in the United States with a correlation coefficient (R) of 0.281 and weighted average of 14.9%, a difference of 12.4%.
Female Disability Correlation Summary
| Measurement | Tlingit-Haida | Immigrants from the Azores |
| Minimum | 8.2% | 5.0% |
| Maximum | 34.5% | 24.0% |
| Range | 26.2% | 19.1% |
| Mean | 15.5% | 13.8% |
| Median | 13.7% | 13.1% |
| Interquartile 25% (IQ1) | 11.8% | 11.9% |
| Interquartile 75% (IQ3) | 17.3% | 16.3% |
| Interquartile Range (IQR) | 5.5% | 4.5% |
| Standard Deviation (Sample) | 5.7% | 4.1% |
| Standard Deviation (Population) | 5.6% | 4.0% |
Similar Demographics by Female Disability
Demographics Similar to Tlingit-Haida by Female Disability
In terms of female disability, the demographic groups most similar to Tlingit-Haida are Immigrants from Yemen (13.2%, a difference of 0.0%), Shoshone (13.2%, a difference of 0.060%), White/Caucasian (13.2%, a difference of 0.17%), Yakama (13.2%, a difference of 0.23%), and Yaqui (13.2%, a difference of 0.27%).
| Demographics | Rating | Rank | Female Disability |
| Welsh | 0.0 /100 | #282 | Tragic 13.1% |
| English | 0.0 /100 | #283 | Tragic 13.1% |
| Hmong | 0.0 /100 | #284 | Tragic 13.1% |
| Bangladeshis | 0.0 /100 | #285 | Tragic 13.1% |
| Fijians | 0.0 /100 | #286 | Tragic 13.1% |
| Yaqui | 0.0 /100 | #287 | Tragic 13.2% |
| Whites/Caucasians | 0.0 /100 | #288 | Tragic 13.2% |
| Tlingit-Haida | 0.0 /100 | #289 | Tragic 13.2% |
| Immigrants | Yemen | 0.0 /100 | #290 | Tragic 13.2% |
| Shoshone | 0.0 /100 | #291 | Tragic 13.2% |
| Yakama | 0.0 /100 | #292 | Tragic 13.2% |
| Marshallese | 0.0 /100 | #293 | Tragic 13.3% |
| Celtics | 0.0 /100 | #294 | Tragic 13.3% |
| French | 0.0 /100 | #295 | Tragic 13.3% |
| Nepalese | 0.0 /100 | #296 | Tragic 13.3% |
Demographics Similar to Immigrants from the Azores by Female Disability
In terms of female disability, the demographic groups most similar to Immigrants from the Azores are Cherokee (14.9%, a difference of 0.090%), Cajun (14.9%, a difference of 0.11%), Pima (14.8%, a difference of 0.39%), Seminole (15.0%, a difference of 0.79%), and Tohono O'odham (15.0%, a difference of 0.91%).
| Demographics | Rating | Rank | Female Disability |
| Comanche | 0.0 /100 | #326 | Tragic 14.2% |
| Ottawa | 0.0 /100 | #327 | Tragic 14.2% |
| Cape Verdeans | 0.0 /100 | #328 | Tragic 14.2% |
| Osage | 0.0 /100 | #329 | Tragic 14.3% |
| Yuman | 0.0 /100 | #330 | Tragic 14.5% |
| Immigrants | Cabo Verde | 0.0 /100 | #331 | Tragic 14.6% |
| Pima | 0.0 /100 | #332 | Tragic 14.8% |
| Immigrants | Azores | 0.0 /100 | #333 | Tragic 14.9% |
| Cherokee | 0.0 /100 | #334 | Tragic 14.9% |
| Cajuns | 0.0 /100 | #335 | Tragic 14.9% |
| Seminole | 0.0 /100 | #336 | Tragic 15.0% |
| Tohono O'odham | 0.0 /100 | #337 | Tragic 15.0% |
| Dutch West Indians | 0.0 /100 | #338 | Tragic 15.0% |
| Colville | 0.0 /100 | #339 | Tragic 15.1% |
| Chickasaw | 0.0 /100 | #340 | Tragic 15.2% |