Tlingit-Haida vs Immigrants from Oceania Divorced or Separated
COMPARE
Tlingit-Haida
Immigrants from Oceania
Divorced or Separated
Divorced or Separated Comparison
Tlingit-Haida
Immigrants from Oceania
13.2%
DIVORCED OR SEPARATED
0.0/ 100
METRIC RATING
306th/ 347
METRIC RANK
11.9%
DIVORCED OR SEPARATED
77.7/ 100
METRIC RATING
149th/ 347
METRIC RANK
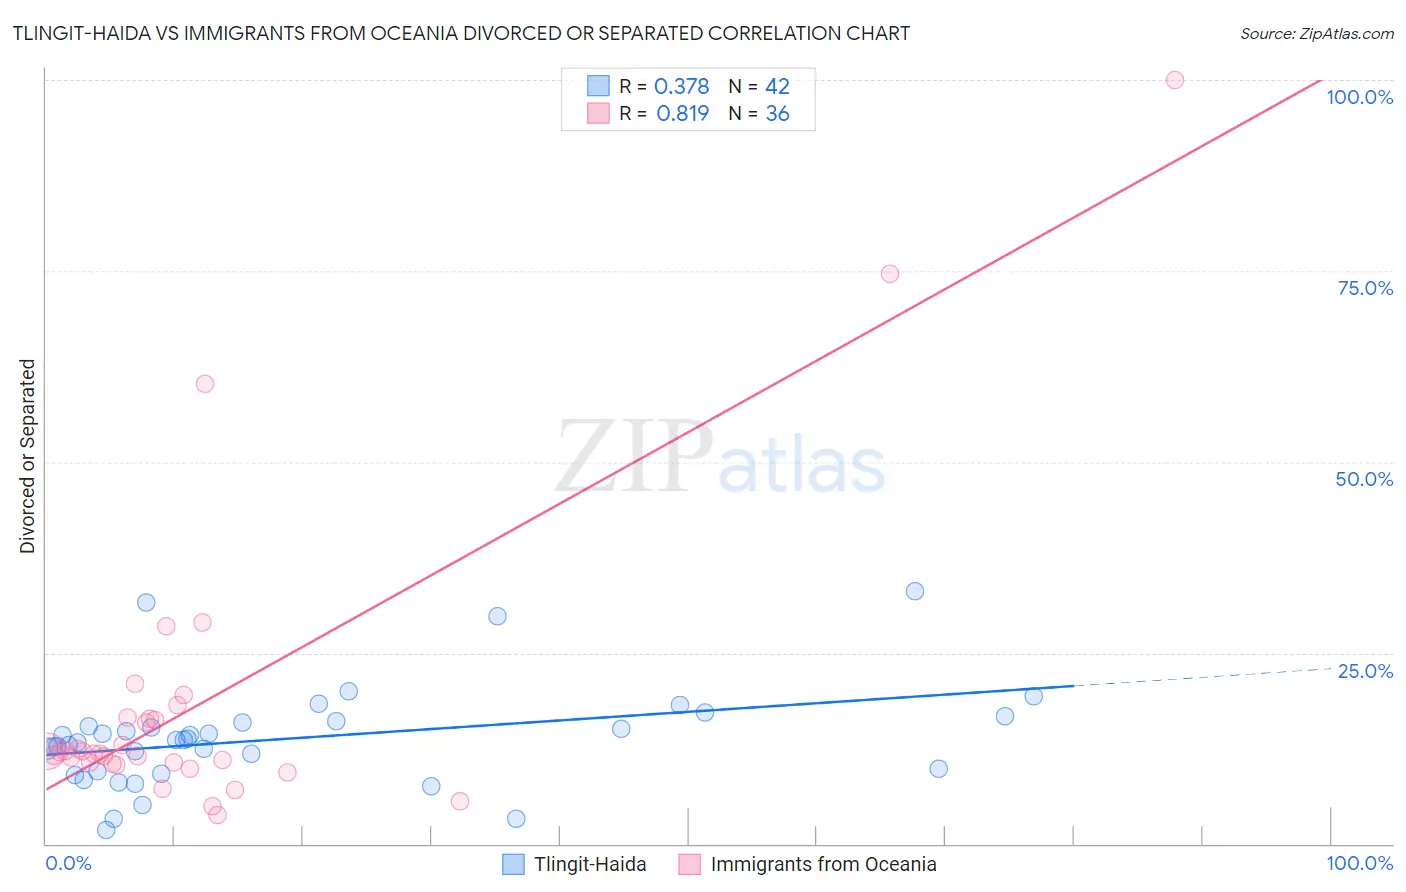
Tlingit-Haida vs Immigrants from Oceania Divorced or Separated Correlation Chart
The statistical analysis conducted on geographies consisting of 60,872,098 people shows a mild positive correlation between the proportion of Tlingit-Haida and percentage of population currently divorced or separated in the United States with a correlation coefficient (R) of 0.378 and weighted average of 13.2%. Similarly, the statistical analysis conducted on geographies consisting of 305,431,368 people shows a very strong positive correlation between the proportion of Immigrants from Oceania and percentage of population currently divorced or separated in the United States with a correlation coefficient (R) of 0.819 and weighted average of 11.9%, a difference of 10.6%.
Divorced or Separated Correlation Summary
| Measurement | Tlingit-Haida | Immigrants from Oceania |
| Minimum | 1.8% | 3.7% |
| Maximum | 33.1% | 100.0% |
| Range | 31.3% | 96.3% |
| Mean | 13.8% | 18.3% |
| Median | 13.6% | 11.9% |
| Interquartile 25% (IQ1) | 9.4% | 10.5% |
| Interquartile 75% (IQ3) | 15.9% | 16.5% |
| Interquartile Range (IQR) | 6.5% | 5.9% |
| Standard Deviation (Sample) | 6.6% | 19.7% |
| Standard Deviation (Population) | 6.5% | 19.4% |
Similar Demographics by Divorced or Separated
Demographics Similar to Tlingit-Haida by Divorced or Separated
In terms of divorced or separated, the demographic groups most similar to Tlingit-Haida are Chippewa (13.2%, a difference of 0.16%), Hopi (13.2%, a difference of 0.22%), French American Indian (13.2%, a difference of 0.25%), Ottawa (13.2%, a difference of 0.34%), and Cape Verdean (13.1%, a difference of 0.35%).
| Demographics | Rating | Rank | Divorced or Separated |
| Immigrants | Jamaica | 0.0 /100 | #299 | Tragic 13.0% |
| Immigrants | Cabo Verde | 0.0 /100 | #300 | Tragic 13.1% |
| Alaskan Athabascans | 0.0 /100 | #301 | Tragic 13.1% |
| Immigrants | Venezuela | 0.0 /100 | #302 | Tragic 13.1% |
| Cape Verdeans | 0.0 /100 | #303 | Tragic 13.1% |
| Hopi | 0.0 /100 | #304 | Tragic 13.2% |
| Chippewa | 0.0 /100 | #305 | Tragic 13.2% |
| Tlingit-Haida | 0.0 /100 | #306 | Tragic 13.2% |
| French American Indians | 0.0 /100 | #307 | Tragic 13.2% |
| Ottawa | 0.0 /100 | #308 | Tragic 13.2% |
| Americans | 0.0 /100 | #309 | Tragic 13.2% |
| Africans | 0.0 /100 | #310 | Tragic 13.2% |
| Sioux | 0.0 /100 | #311 | Tragic 13.2% |
| Blackfeet | 0.0 /100 | #312 | Tragic 13.3% |
| Immigrants | Nicaragua | 0.0 /100 | #313 | Tragic 13.3% |
Demographics Similar to Immigrants from Oceania by Divorced or Separated
In terms of divorced or separated, the demographic groups most similar to Immigrants from Oceania are Italian (11.9%, a difference of 0.0%), Immigrants from Portugal (11.9%, a difference of 0.020%), Polish (11.9%, a difference of 0.050%), Czech (11.9%, a difference of 0.060%), and Immigrants from Grenada (11.9%, a difference of 0.070%).
| Demographics | Rating | Rank | Divorced or Separated |
| Immigrants | Zimbabwe | 81.5 /100 | #142 | Excellent 11.9% |
| Pakistanis | 81.3 /100 | #143 | Excellent 11.9% |
| Peruvians | 80.9 /100 | #144 | Excellent 11.9% |
| Croatians | 80.6 /100 | #145 | Excellent 11.9% |
| Immigrants | Grenada | 79.1 /100 | #146 | Good 11.9% |
| Poles | 78.6 /100 | #147 | Good 11.9% |
| Italians | 77.8 /100 | #148 | Good 11.9% |
| Immigrants | Oceania | 77.7 /100 | #149 | Good 11.9% |
| Immigrants | Portugal | 77.3 /100 | #150 | Good 11.9% |
| Czechs | 76.4 /100 | #151 | Good 11.9% |
| Immigrants | Hungary | 73.7 /100 | #152 | Good 11.9% |
| Austrians | 72.2 /100 | #153 | Good 12.0% |
| Chileans | 71.3 /100 | #154 | Good 12.0% |
| Japanese | 70.9 /100 | #155 | Good 12.0% |
| Hungarians | 70.3 /100 | #156 | Good 12.0% |