Tlingit-Haida vs Immigrants from Croatia Professional Degree
COMPARE
Tlingit-Haida
Immigrants from Croatia
Professional Degree
Professional Degree Comparison
Tlingit-Haida
Immigrants from Croatia
4.0%
PROFESSIONAL DEGREE
6.9/ 100
METRIC RATING
225th/ 347
METRIC RANK
5.3%
PROFESSIONAL DEGREE
99.6/ 100
METRIC RATING
84th/ 347
METRIC RANK
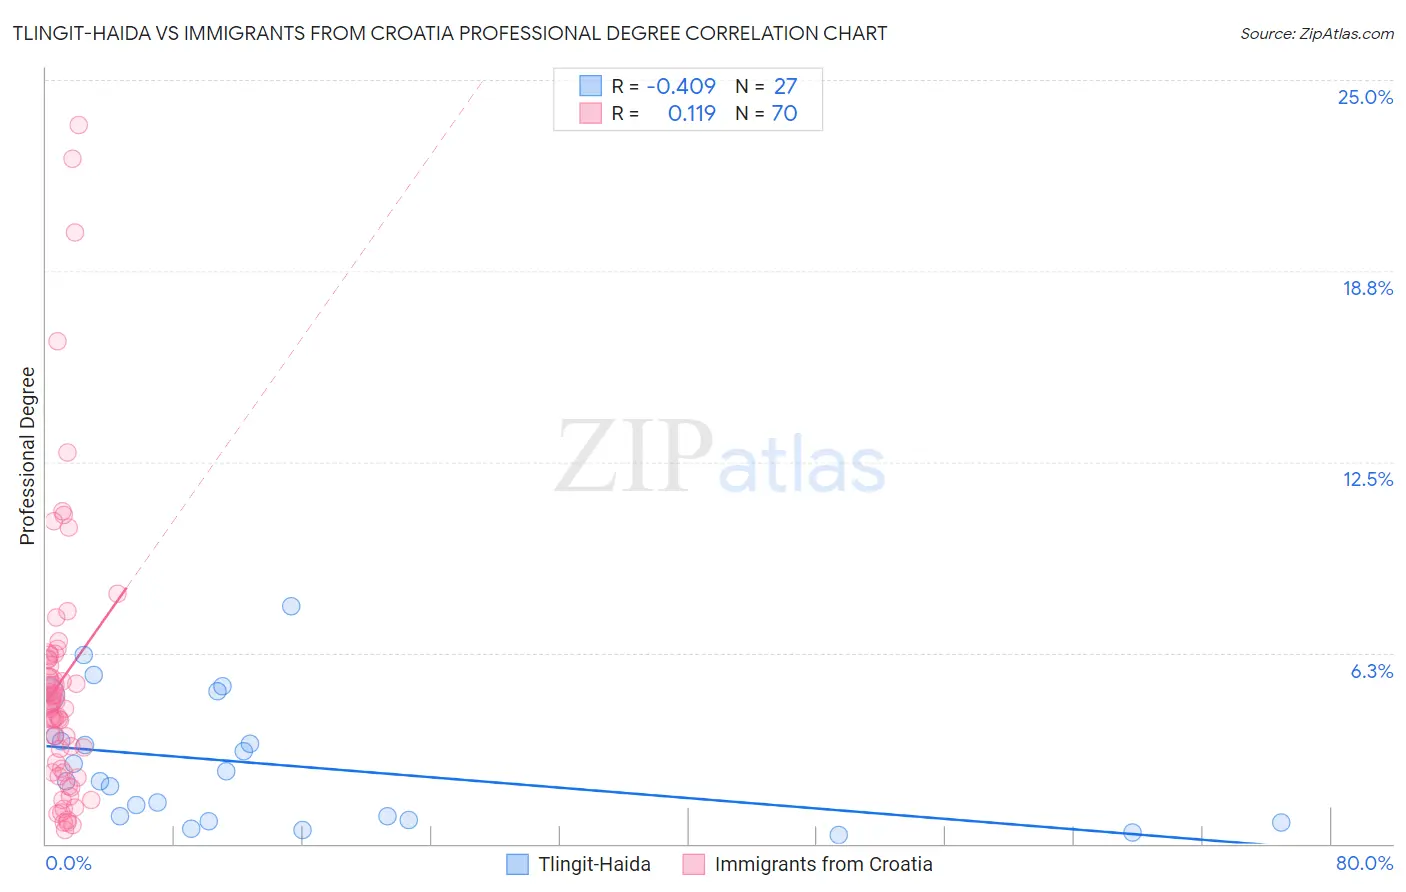
Tlingit-Haida vs Immigrants from Croatia Professional Degree Correlation Chart
The statistical analysis conducted on geographies consisting of 60,804,228 people shows a moderate negative correlation between the proportion of Tlingit-Haida and percentage of population with at least professional degree education in the United States with a correlation coefficient (R) of -0.409 and weighted average of 4.0%. Similarly, the statistical analysis conducted on geographies consisting of 132,543,380 people shows a poor positive correlation between the proportion of Immigrants from Croatia and percentage of population with at least professional degree education in the United States with a correlation coefficient (R) of 0.119 and weighted average of 5.3%, a difference of 32.1%.
Professional Degree Correlation Summary
| Measurement | Tlingit-Haida | Immigrants from Croatia |
| Minimum | 0.29% | 0.47% |
| Maximum | 7.8% | 23.5% |
| Range | 7.5% | 23.1% |
| Mean | 2.6% | 5.3% |
| Median | 2.0% | 4.5% |
| Interquartile 25% (IQ1) | 0.79% | 2.3% |
| Interquartile 75% (IQ3) | 3.5% | 6.1% |
| Interquartile Range (IQR) | 2.7% | 3.7% |
| Standard Deviation (Sample) | 2.0% | 4.7% |
| Standard Deviation (Population) | 2.0% | 4.6% |
Similar Demographics by Professional Degree
Demographics Similar to Tlingit-Haida by Professional Degree
In terms of professional degree, the demographic groups most similar to Tlingit-Haida are Trinidadian and Tobagonian (4.0%, a difference of 0.13%), Immigrants from Bosnia and Herzegovina (4.0%, a difference of 0.27%), Immigrants from Western Africa (4.0%, a difference of 0.35%), German Russian (4.0%, a difference of 0.55%), and French Canadian (4.0%, a difference of 0.60%).
| Demographics | Rating | Rank | Professional Degree |
| Dutch | 9.0 /100 | #218 | Tragic 4.0% |
| Immigrants | South Eastern Asia | 8.9 /100 | #219 | Tragic 4.0% |
| Ute | 8.2 /100 | #220 | Tragic 4.0% |
| French Canadians | 8.0 /100 | #221 | Tragic 4.0% |
| Immigrants | Western Africa | 7.5 /100 | #222 | Tragic 4.0% |
| Immigrants | Bosnia and Herzegovina | 7.4 /100 | #223 | Tragic 4.0% |
| Trinidadians and Tobagonians | 7.1 /100 | #224 | Tragic 4.0% |
| Tlingit-Haida | 6.9 /100 | #225 | Tragic 4.0% |
| German Russians | 6.1 /100 | #226 | Tragic 4.0% |
| Cubans | 5.9 /100 | #227 | Tragic 4.0% |
| Immigrants | West Indies | 5.6 /100 | #228 | Tragic 4.0% |
| Immigrants | Burma/Myanmar | 5.4 /100 | #229 | Tragic 3.9% |
| Nicaraguans | 5.1 /100 | #230 | Tragic 3.9% |
| Ecuadorians | 4.6 /100 | #231 | Tragic 3.9% |
| Cree | 4.3 /100 | #232 | Tragic 3.9% |
Demographics Similar to Immigrants from Croatia by Professional Degree
In terms of professional degree, the demographic groups most similar to Immigrants from Croatia are Carpatho Rusyn (5.3%, a difference of 0.0%), Immigrants from Zimbabwe (5.3%, a difference of 0.020%), Greek (5.3%, a difference of 0.020%), Immigrants from Chile (5.3%, a difference of 0.13%), and Romanian (5.3%, a difference of 0.20%).
| Demographics | Rating | Rank | Professional Degree |
| Immigrants | Ethiopia | 99.7 /100 | #77 | Exceptional 5.3% |
| Armenians | 99.7 /100 | #78 | Exceptional 5.3% |
| Immigrants | North America | 99.7 /100 | #79 | Exceptional 5.3% |
| Immigrants | England | 99.6 /100 | #80 | Exceptional 5.3% |
| Immigrants | Brazil | 99.6 /100 | #81 | Exceptional 5.3% |
| Romanians | 99.6 /100 | #82 | Exceptional 5.3% |
| Carpatho Rusyns | 99.6 /100 | #83 | Exceptional 5.3% |
| Immigrants | Croatia | 99.6 /100 | #84 | Exceptional 5.3% |
| Immigrants | Zimbabwe | 99.6 /100 | #85 | Exceptional 5.3% |
| Greeks | 99.6 /100 | #86 | Exceptional 5.3% |
| Immigrants | Chile | 99.5 /100 | #87 | Exceptional 5.3% |
| Egyptians | 99.5 /100 | #88 | Exceptional 5.3% |
| Chileans | 99.5 /100 | #89 | Exceptional 5.3% |
| Immigrants | Scotland | 99.5 /100 | #90 | Exceptional 5.3% |
| Laotians | 99.5 /100 | #91 | Exceptional 5.2% |