Immigrants from Congo vs French Canadian Disability Age Over 75
COMPARE
Immigrants from Congo
French Canadian
Disability Age Over 75
Disability Age Over 75 Comparison
Immigrants from Congo
French Canadians
48.7%
DISABILITY AGE OVER 75
0.5/ 100
METRIC RATING
256th/ 347
METRIC RANK
47.0%
DISABILITY AGE OVER 75
79.0/ 100
METRIC RATING
151st/ 347
METRIC RANK
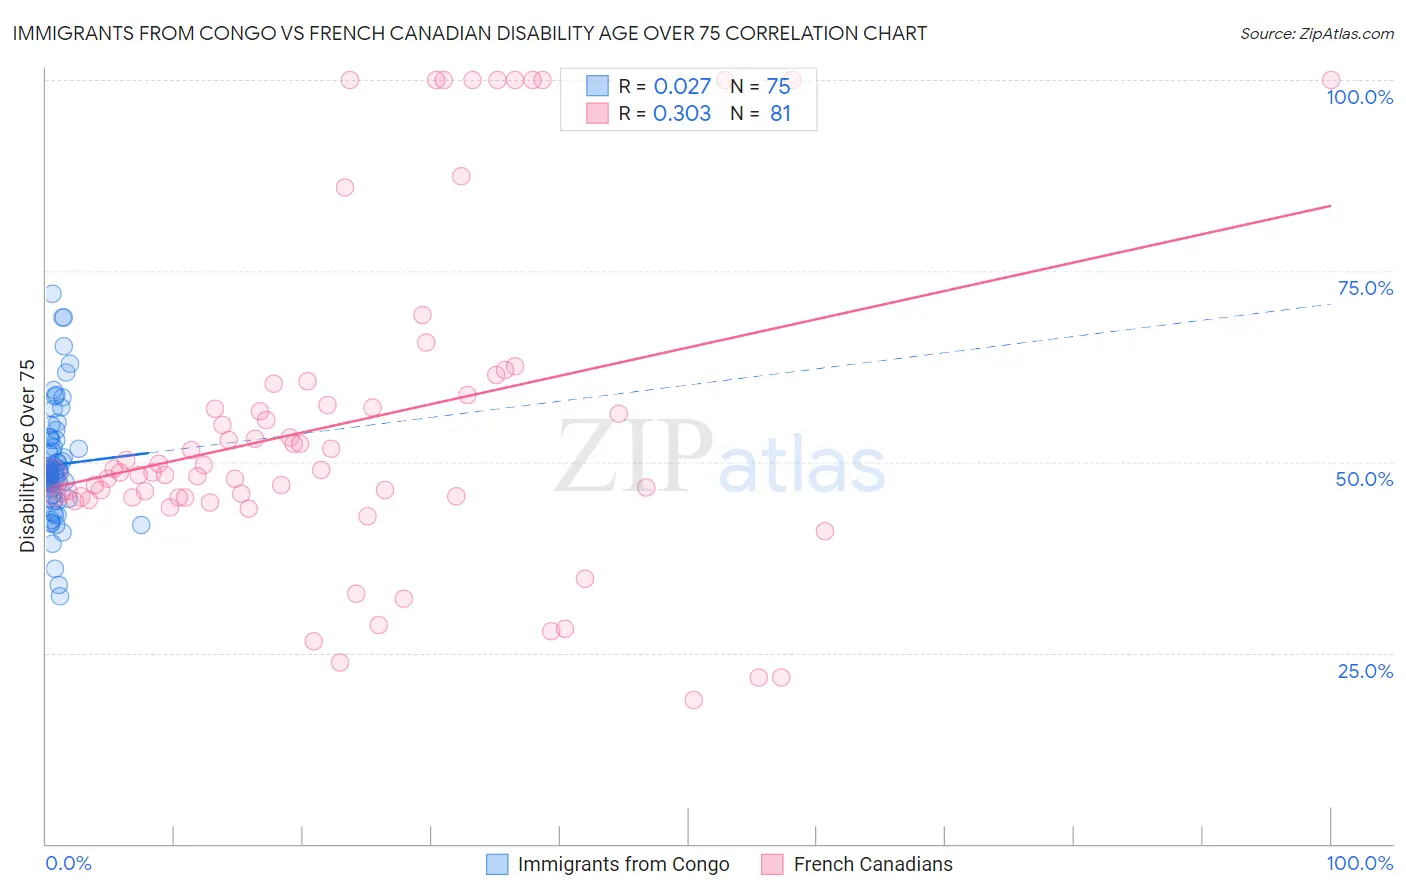
Immigrants from Congo vs French Canadian Disability Age Over 75 Correlation Chart
The statistical analysis conducted on geographies consisting of 92,072,381 people shows no correlation between the proportion of Immigrants from Congo and percentage of population with a disability over the age of 75 in the United States with a correlation coefficient (R) of 0.027 and weighted average of 48.7%. Similarly, the statistical analysis conducted on geographies consisting of 501,362,781 people shows a mild positive correlation between the proportion of French Canadians and percentage of population with a disability over the age of 75 in the United States with a correlation coefficient (R) of 0.303 and weighted average of 47.0%, a difference of 3.7%.
Disability Age Over 75 Correlation Summary
| Measurement | Immigrants from Congo | French Canadian |
| Minimum | 32.4% | 18.8% |
| Maximum | 72.0% | 100.0% |
| Range | 39.6% | 81.2% |
| Mean | 49.6% | 55.1% |
| Median | 48.6% | 48.7% |
| Interquartile 25% (IQ1) | 45.7% | 45.4% |
| Interquartile 75% (IQ3) | 52.8% | 59.5% |
| Interquartile Range (IQR) | 7.1% | 14.1% |
| Standard Deviation (Sample) | 7.3% | 21.3% |
| Standard Deviation (Population) | 7.2% | 21.2% |
Similar Demographics by Disability Age Over 75
Demographics Similar to Immigrants from Congo by Disability Age Over 75
In terms of disability age over 75, the demographic groups most similar to Immigrants from Congo are Chinese (48.7%, a difference of 0.010%), Immigrants from Vietnam (48.7%, a difference of 0.050%), Blackfeet (48.8%, a difference of 0.050%), British West Indian (48.7%, a difference of 0.080%), and Immigrants from Philippines (48.8%, a difference of 0.090%).
| Demographics | Rating | Rank | Disability Age Over 75 |
| Iraqis | 1.0 /100 | #249 | Tragic 48.6% |
| West Indians | 0.8 /100 | #250 | Tragic 48.6% |
| Koreans | 0.8 /100 | #251 | Tragic 48.6% |
| Immigrants | South Eastern Asia | 0.7 /100 | #252 | Tragic 48.7% |
| British West Indians | 0.6 /100 | #253 | Tragic 48.7% |
| Immigrants | Vietnam | 0.6 /100 | #254 | Tragic 48.7% |
| Chinese | 0.5 /100 | #255 | Tragic 48.7% |
| Immigrants | Congo | 0.5 /100 | #256 | Tragic 48.7% |
| Blackfeet | 0.5 /100 | #257 | Tragic 48.8% |
| Immigrants | Philippines | 0.4 /100 | #258 | Tragic 48.8% |
| Central Americans | 0.4 /100 | #259 | Tragic 48.8% |
| Immigrants | Afghanistan | 0.4 /100 | #260 | Tragic 48.8% |
| Africans | 0.3 /100 | #261 | Tragic 48.9% |
| Immigrants | West Indies | 0.3 /100 | #262 | Tragic 48.9% |
| Salvadorans | 0.3 /100 | #263 | Tragic 48.9% |
Demographics Similar to French Canadians by Disability Age Over 75
In terms of disability age over 75, the demographic groups most similar to French Canadians are Immigrants from Russia (47.0%, a difference of 0.010%), Welsh (47.0%, a difference of 0.080%), Immigrants from Asia (47.0%, a difference of 0.080%), Asian (46.9%, a difference of 0.090%), and Immigrants from Zaire (47.1%, a difference of 0.13%).
| Demographics | Rating | Rank | Disability Age Over 75 |
| Venezuelans | 85.0 /100 | #144 | Excellent 46.9% |
| Costa Ricans | 84.5 /100 | #145 | Excellent 46.9% |
| Guyanese | 84.3 /100 | #146 | Excellent 46.9% |
| Immigrants | Peru | 84.1 /100 | #147 | Excellent 46.9% |
| Asians | 81.6 /100 | #148 | Excellent 46.9% |
| Welsh | 81.3 /100 | #149 | Excellent 47.0% |
| Immigrants | Russia | 79.3 /100 | #150 | Good 47.0% |
| French Canadians | 79.0 /100 | #151 | Good 47.0% |
| Immigrants | Asia | 76.5 /100 | #152 | Good 47.0% |
| Immigrants | Zaire | 74.8 /100 | #153 | Good 47.1% |
| Immigrants | Belarus | 74.8 /100 | #154 | Good 47.1% |
| Immigrants | Iran | 74.7 /100 | #155 | Good 47.1% |
| Arabs | 73.3 /100 | #156 | Good 47.1% |
| Bhutanese | 72.6 /100 | #157 | Good 47.1% |
| Immigrants | Guyana | 71.9 /100 | #158 | Good 47.1% |