Soviet Union vs Austrian Disability Age Over 75
COMPARE
Soviet Union
Austrian
Disability Age Over 75
Disability Age Over 75 Comparison
Soviet Union
Austrians
46.2%
DISABILITY AGE OVER 75
98.8/ 100
METRIC RATING
80th/ 347
METRIC RANK
46.0%
DISABILITY AGE OVER 75
99.5/ 100
METRIC RATING
65th/ 347
METRIC RANK
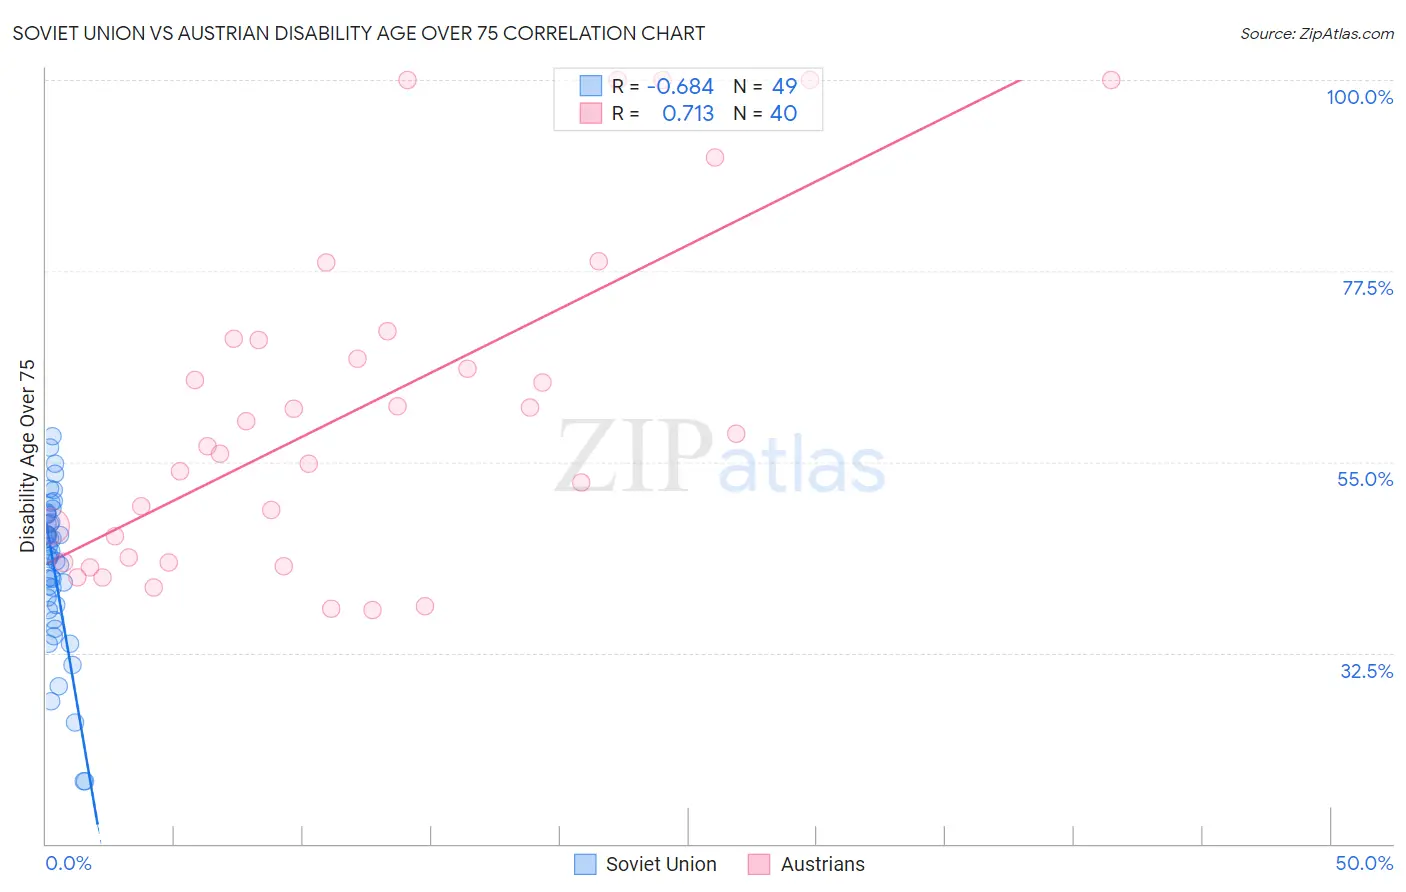
Soviet Union vs Austrian Disability Age Over 75 Correlation Chart
The statistical analysis conducted on geographies consisting of 43,492,822 people shows a significant negative correlation between the proportion of Soviet Union and percentage of population with a disability over the age of 75 in the United States with a correlation coefficient (R) of -0.684 and weighted average of 46.2%. Similarly, the statistical analysis conducted on geographies consisting of 451,276,347 people shows a strong positive correlation between the proportion of Austrians and percentage of population with a disability over the age of 75 in the United States with a correlation coefficient (R) of 0.713 and weighted average of 46.0%, a difference of 0.50%.
Disability Age Over 75 Correlation Summary
| Measurement | Soviet Union | Austrian |
| Minimum | 17.4% | 37.6% |
| Maximum | 58.1% | 100.0% |
| Range | 40.7% | 62.4% |
| Mean | 42.4% | 61.0% |
| Median | 43.9% | 57.6% |
| Interquartile 25% (IQ1) | 37.9% | 43.5% |
| Interquartile 75% (IQ3) | 48.3% | 69.5% |
| Interquartile Range (IQR) | 10.4% | 26.0% |
| Standard Deviation (Sample) | 9.0% | 19.4% |
| Standard Deviation (Population) | 9.0% | 19.2% |
Demographics Similar to Soviet Union and Austrians by Disability Age Over 75
In terms of disability age over 75, the demographic groups most similar to Soviet Union are Swiss (46.2%, a difference of 0.0%), New Zealander (46.2%, a difference of 0.0%), Immigrants from Latvia (46.2%, a difference of 0.020%), Immigrants from Western Europe (46.2%, a difference of 0.040%), and Immigrants from Eastern Asia (46.2%, a difference of 0.050%). Similarly, the demographic groups most similar to Austrians are Immigrants from England (46.0%, a difference of 0.010%), Immigrants from North Macedonia (45.9%, a difference of 0.030%), Immigrants from Norway (45.9%, a difference of 0.040%), Immigrants from Spain (46.0%, a difference of 0.040%), and Immigrants from South Central Asia (46.0%, a difference of 0.070%).
| Demographics | Rating | Rank | Disability Age Over 75 |
| Burmese | 99.5 /100 | #62 | Exceptional 45.9% |
| Immigrants | Norway | 99.5 /100 | #63 | Exceptional 45.9% |
| Immigrants | North Macedonia | 99.5 /100 | #64 | Exceptional 45.9% |
| Austrians | 99.5 /100 | #65 | Exceptional 46.0% |
| Immigrants | England | 99.5 /100 | #66 | Exceptional 46.0% |
| Immigrants | Spain | 99.4 /100 | #67 | Exceptional 46.0% |
| Immigrants | South Central Asia | 99.4 /100 | #68 | Exceptional 46.0% |
| Immigrants | Romania | 99.3 /100 | #69 | Exceptional 46.0% |
| Jordanians | 99.2 /100 | #70 | Exceptional 46.1% |
| Immigrants | Sri Lanka | 99.2 /100 | #71 | Exceptional 46.1% |
| Immigrants | Hungary | 99.1 /100 | #72 | Exceptional 46.1% |
| Cambodians | 99.1 /100 | #73 | Exceptional 46.1% |
| Egyptians | 99.0 /100 | #74 | Exceptional 46.1% |
| Serbians | 99.0 /100 | #75 | Exceptional 46.1% |
| Slavs | 98.9 /100 | #76 | Exceptional 46.1% |
| Immigrants | Eastern Asia | 98.9 /100 | #77 | Exceptional 46.2% |
| Immigrants | Western Europe | 98.8 /100 | #78 | Exceptional 46.2% |
| Swiss | 98.8 /100 | #79 | Exceptional 46.2% |
| Soviet Union | 98.8 /100 | #80 | Exceptional 46.2% |
| New Zealanders | 98.8 /100 | #81 | Exceptional 46.2% |
| Immigrants | Latvia | 98.7 /100 | #82 | Exceptional 46.2% |