Black/African American vs Houma Disability Age 65 to 74
COMPARE
Black/African American
Houma
Disability Age 65 to 74
Disability Age 65 to 74 Comparison
Blacks/African Americans
Houma
27.3%
DISABILITY AGE 65 TO 74
0.0/ 100
METRIC RATING
306th/ 347
METRIC RANK
32.3%
DISABILITY AGE 65 TO 74
0.0/ 100
METRIC RATING
337th/ 347
METRIC RANK
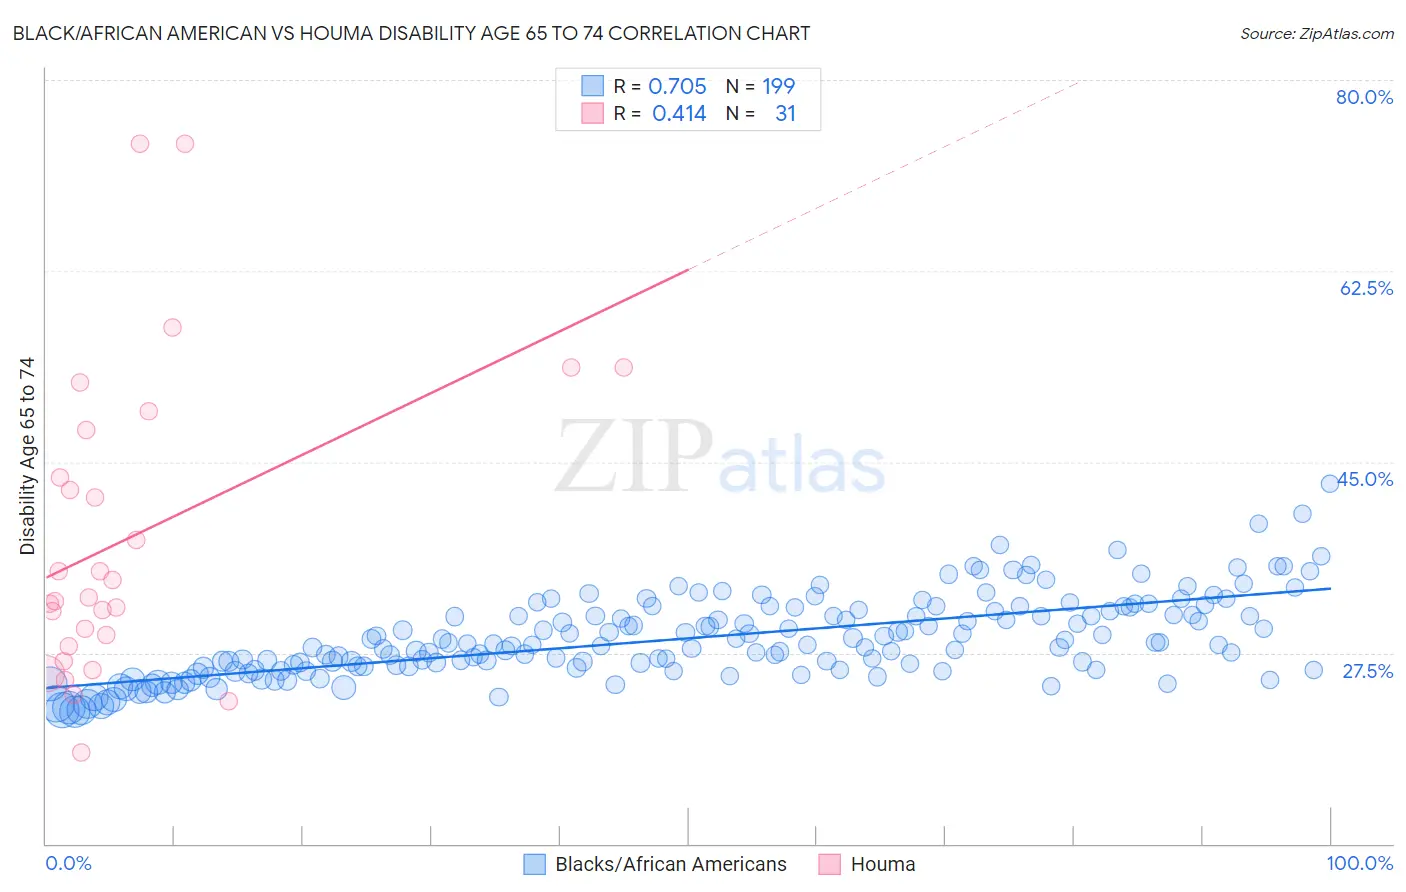
Black/African American vs Houma Disability Age 65 to 74 Correlation Chart
The statistical analysis conducted on geographies consisting of 563,649,388 people shows a strong positive correlation between the proportion of Blacks/African Americans and percentage of population with a disability between the ages 65 and 75 in the United States with a correlation coefficient (R) of 0.705 and weighted average of 27.3%. Similarly, the statistical analysis conducted on geographies consisting of 36,769,608 people shows a moderate positive correlation between the proportion of Houma and percentage of population with a disability between the ages 65 and 75 in the United States with a correlation coefficient (R) of 0.414 and weighted average of 32.3%, a difference of 18.3%.
Disability Age 65 to 74 Correlation Summary
| Measurement | Black/African American | Houma |
| Minimum | 22.1% | 18.4% |
| Maximum | 43.0% | 74.2% |
| Range | 20.9% | 55.8% |
| Mean | 28.8% | 38.1% |
| Median | 28.2% | 32.5% |
| Interquartile 25% (IQ1) | 26.1% | 28.1% |
| Interquartile 75% (IQ3) | 31.3% | 47.9% |
| Interquartile Range (IQR) | 5.2% | 19.8% |
| Standard Deviation (Sample) | 3.7% | 14.0% |
| Standard Deviation (Population) | 3.7% | 13.8% |
Similar Demographics by Disability Age 65 to 74
Demographics Similar to Blacks/African Americans by Disability Age 65 to 74
In terms of disability age 65 to 74, the demographic groups most similar to Blacks/African Americans are Ute (27.3%, a difference of 0.060%), Sioux (27.3%, a difference of 0.21%), Yaqui (27.4%, a difference of 0.27%), Shoshone (27.4%, a difference of 0.32%), and Mexican (27.2%, a difference of 0.40%).
| Demographics | Rating | Rank | Disability Age 65 to 74 |
| Potawatomi | 0.0 /100 | #299 | Tragic 27.0% |
| Immigrants | Dominican Republic | 0.0 /100 | #300 | Tragic 27.0% |
| Immigrants | Mexico | 0.0 /100 | #301 | Tragic 27.1% |
| Central American Indians | 0.0 /100 | #302 | Tragic 27.1% |
| Tlingit-Haida | 0.0 /100 | #303 | Tragic 27.1% |
| Puget Sound Salish | 0.0 /100 | #304 | Tragic 27.2% |
| Mexicans | 0.0 /100 | #305 | Tragic 27.2% |
| Blacks/African Americans | 0.0 /100 | #306 | Tragic 27.3% |
| Ute | 0.0 /100 | #307 | Tragic 27.3% |
| Sioux | 0.0 /100 | #308 | Tragic 27.3% |
| Yaqui | 0.0 /100 | #309 | Tragic 27.4% |
| Shoshone | 0.0 /100 | #310 | Tragic 27.4% |
| Menominee | 0.0 /100 | #311 | Tragic 27.4% |
| Osage | 0.0 /100 | #312 | Tragic 27.5% |
| Paiute | 0.0 /100 | #313 | Tragic 27.8% |
Demographics Similar to Houma by Disability Age 65 to 74
In terms of disability age 65 to 74, the demographic groups most similar to Houma are Alaskan Athabascan (32.4%, a difference of 0.19%), Kiowa (32.6%, a difference of 0.81%), Lumbee (32.7%, a difference of 1.3%), Tsimshian (32.9%, a difference of 1.9%), and Pueblo (33.1%, a difference of 2.5%).
| Demographics | Rating | Rank | Disability Age 65 to 74 |
| Creek | 0.0 /100 | #330 | Tragic 30.2% |
| Chickasaw | 0.0 /100 | #331 | Tragic 30.2% |
| Natives/Alaskans | 0.0 /100 | #332 | Tragic 30.4% |
| Colville | 0.0 /100 | #333 | Tragic 30.5% |
| Alaska Natives | 0.0 /100 | #334 | Tragic 30.6% |
| Cheyenne | 0.0 /100 | #335 | Tragic 31.1% |
| Yuman | 0.0 /100 | #336 | Tragic 31.5% |
| Houma | 0.0 /100 | #337 | Tragic 32.3% |
| Alaskan Athabascans | 0.0 /100 | #338 | Tragic 32.4% |
| Kiowa | 0.0 /100 | #339 | Tragic 32.6% |
| Lumbee | 0.0 /100 | #340 | Tragic 32.7% |
| Tsimshian | 0.0 /100 | #341 | Tragic 32.9% |
| Pueblo | 0.0 /100 | #342 | Tragic 33.1% |
| Navajo | 0.0 /100 | #343 | Tragic 33.3% |
| Inupiat | 0.0 /100 | #344 | Tragic 34.5% |