Subsaharan African vs Dominican 6th Grade
COMPARE
Subsaharan African
Dominican
6th Grade
6th Grade Comparison
Sub-Saharan Africans
Dominicans
96.7%
6TH GRADE
3.5/ 100
METRIC RATING
231st/ 347
METRIC RANK
94.9%
6TH GRADE
0.0/ 100
METRIC RATING
329th/ 347
METRIC RANK
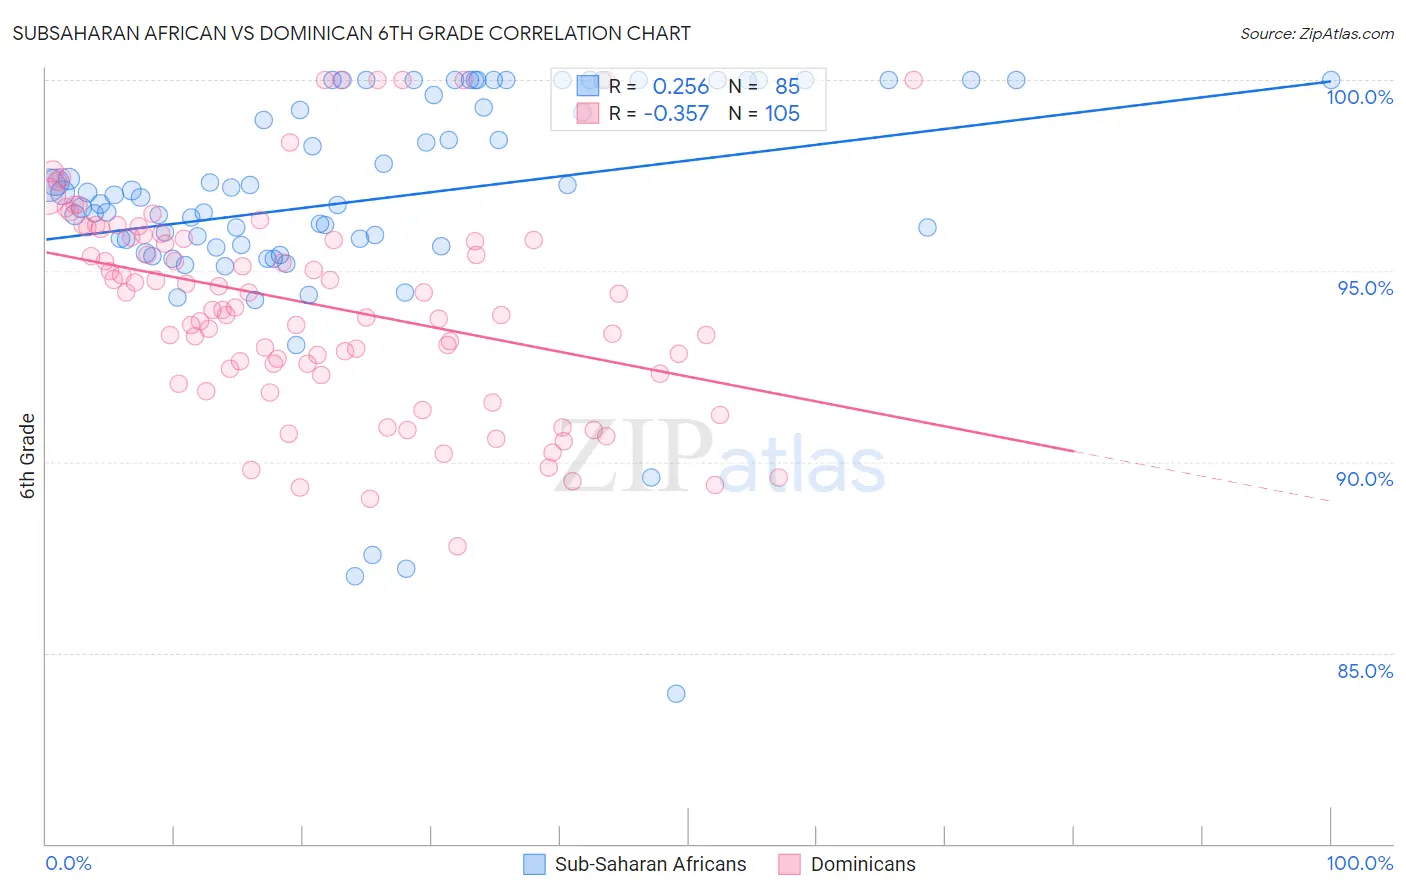
Subsaharan African vs Dominican 6th Grade Correlation Chart
The statistical analysis conducted on geographies consisting of 508,219,094 people shows a weak positive correlation between the proportion of Sub-Saharan Africans and percentage of population with at least 6th grade education in the United States with a correlation coefficient (R) of 0.256 and weighted average of 96.7%. Similarly, the statistical analysis conducted on geographies consisting of 355,142,603 people shows a mild negative correlation between the proportion of Dominicans and percentage of population with at least 6th grade education in the United States with a correlation coefficient (R) of -0.357 and weighted average of 94.9%, a difference of 1.8%.
6th Grade Correlation Summary
| Measurement | Subsaharan African | Dominican |
| Minimum | 83.9% | 87.8% |
| Maximum | 100.0% | 100.0% |
| Range | 16.1% | 12.2% |
| Mean | 96.9% | 94.1% |
| Median | 97.0% | 94.0% |
| Interquartile 25% (IQ1) | 95.7% | 92.4% |
| Interquartile 75% (IQ3) | 100.0% | 95.9% |
| Interquartile Range (IQR) | 4.3% | 3.5% |
| Standard Deviation (Sample) | 3.1% | 2.7% |
| Standard Deviation (Population) | 3.1% | 2.7% |
Similar Demographics by 6th Grade
Demographics Similar to Sub-Saharan Africans by 6th Grade
In terms of 6th grade, the demographic groups most similar to Sub-Saharan Africans are South American Indian (96.7%, a difference of 0.0%), Immigrants from Eastern Asia (96.7%, a difference of 0.010%), Yuman (96.7%, a difference of 0.010%), Immigrants from Panama (96.7%, a difference of 0.020%), and Immigrants from Western Asia (96.7%, a difference of 0.020%).
| Demographics | Rating | Rank | 6th Grade |
| Immigrants | Southern Europe | 4.4 /100 | #224 | Tragic 96.7% |
| Immigrants | Pakistan | 4.4 /100 | #225 | Tragic 96.7% |
| Immigrants | Panama | 4.2 /100 | #226 | Tragic 96.7% |
| Immigrants | Western Asia | 4.1 /100 | #227 | Tragic 96.7% |
| Immigrants | Malaysia | 4.0 /100 | #228 | Tragic 96.7% |
| Assyrians/Chaldeans/Syriacs | 4.0 /100 | #229 | Tragic 96.7% |
| Immigrants | Eastern Asia | 4.0 /100 | #230 | Tragic 96.7% |
| Sub-Saharan Africans | 3.5 /100 | #231 | Tragic 96.7% |
| South American Indians | 3.5 /100 | #232 | Tragic 96.7% |
| Yuman | 3.2 /100 | #233 | Tragic 96.7% |
| Uruguayans | 2.5 /100 | #234 | Tragic 96.6% |
| Asians | 2.4 /100 | #235 | Tragic 96.6% |
| Immigrants | Indonesia | 2.3 /100 | #236 | Tragic 96.6% |
| Immigrants | Eastern Africa | 2.0 /100 | #237 | Tragic 96.6% |
| Nigerians | 1.9 /100 | #238 | Tragic 96.6% |
Demographics Similar to Dominicans by 6th Grade
In terms of 6th grade, the demographic groups most similar to Dominicans are Honduran (95.0%, a difference of 0.060%), Mexican American Indian (95.0%, a difference of 0.070%), Nepalese (94.9%, a difference of 0.070%), Immigrants from Armenia (94.9%, a difference of 0.080%), and Hispanic or Latino (95.0%, a difference of 0.10%).
| Demographics | Rating | Rank | 6th Grade |
| Immigrants | Cambodia | 0.0 /100 | #322 | Tragic 95.2% |
| Central American Indians | 0.0 /100 | #323 | Tragic 95.1% |
| Cape Verdeans | 0.0 /100 | #324 | Tragic 95.1% |
| Immigrants | Nicaragua | 0.0 /100 | #325 | Tragic 95.1% |
| Hispanics or Latinos | 0.0 /100 | #326 | Tragic 95.0% |
| Mexican American Indians | 0.0 /100 | #327 | Tragic 95.0% |
| Hondurans | 0.0 /100 | #328 | Tragic 95.0% |
| Dominicans | 0.0 /100 | #329 | Tragic 94.9% |
| Nepalese | 0.0 /100 | #330 | Tragic 94.9% |
| Immigrants | Armenia | 0.0 /100 | #331 | Tragic 94.9% |
| Immigrants | Honduras | 0.0 /100 | #332 | Tragic 94.8% |
| Immigrants | Latin America | 0.0 /100 | #333 | Tragic 94.7% |
| Immigrants | Azores | 0.0 /100 | #334 | Tragic 94.7% |
| Mexicans | 0.0 /100 | #335 | Tragic 94.6% |
| Immigrants | Dominican Republic | 0.0 /100 | #336 | Tragic 94.6% |