Immigrants from Panama vs Dominican Disability Age 65 to 74
COMPARE
Immigrants from Panama
Dominican
Disability Age 65 to 74
Disability Age 65 to 74 Comparison
Immigrants from Panama
Dominicans
24.1%
DISABILITY AGE 65 TO 74
8.6/ 100
METRIC RATING
224th/ 347
METRIC RANK
26.7%
DISABILITY AGE 65 TO 74
0.0/ 100
METRIC RATING
294th/ 347
METRIC RANK
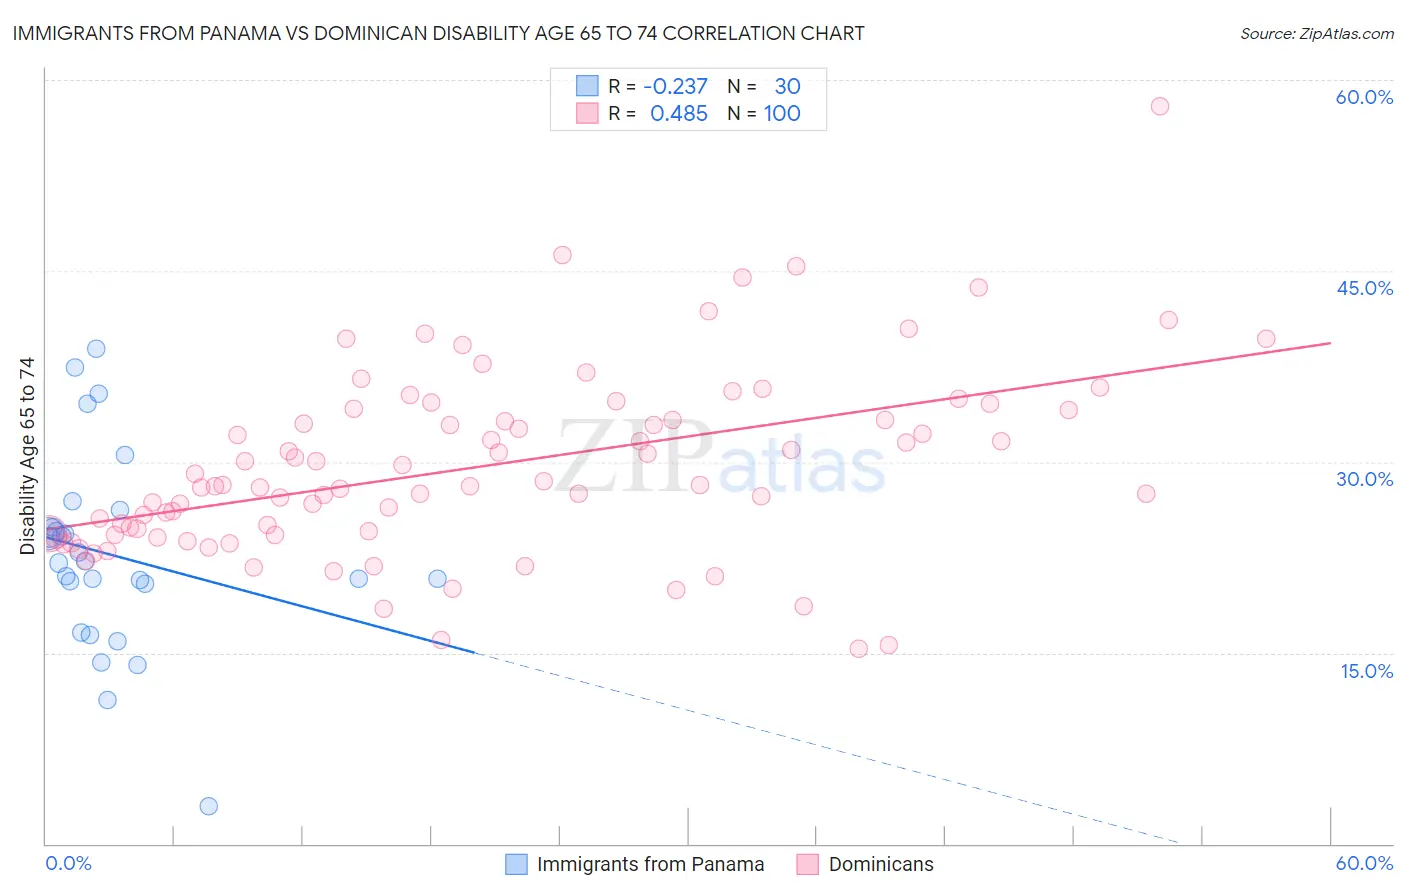
Immigrants from Panama vs Dominican Disability Age 65 to 74 Correlation Chart
The statistical analysis conducted on geographies consisting of 221,053,627 people shows a weak negative correlation between the proportion of Immigrants from Panama and percentage of population with a disability between the ages 65 and 75 in the United States with a correlation coefficient (R) of -0.237 and weighted average of 24.1%. Similarly, the statistical analysis conducted on geographies consisting of 354,107,357 people shows a moderate positive correlation between the proportion of Dominicans and percentage of population with a disability between the ages 65 and 75 in the United States with a correlation coefficient (R) of 0.485 and weighted average of 26.7%, a difference of 10.5%.
Disability Age 65 to 74 Correlation Summary
| Measurement | Immigrants from Panama | Dominican |
| Minimum | 3.0% | 15.3% |
| Maximum | 38.9% | 57.9% |
| Range | 35.9% | 42.6% |
| Mean | 22.7% | 29.6% |
| Median | 22.1% | 28.1% |
| Interquartile 25% (IQ1) | 20.4% | 24.3% |
| Interquartile 75% (IQ3) | 24.9% | 33.6% |
| Interquartile Range (IQR) | 4.4% | 9.4% |
| Standard Deviation (Sample) | 7.7% | 7.3% |
| Standard Deviation (Population) | 7.5% | 7.2% |
Similar Demographics by Disability Age 65 to 74
Demographics Similar to Immigrants from Panama by Disability Age 65 to 74
In terms of disability age 65 to 74, the demographic groups most similar to Immigrants from Panama are Immigrants from Middle Africa (24.1%, a difference of 0.050%), Bermudan (24.2%, a difference of 0.090%), Iraqi (24.2%, a difference of 0.090%), Native Hawaiian (24.1%, a difference of 0.12%), and Nigerian (24.2%, a difference of 0.16%).
| Demographics | Rating | Rank | Disability Age 65 to 74 |
| Immigrants | Portugal | 11.7 /100 | #217 | Poor 24.0% |
| Immigrants | Nigeria | 11.7 /100 | #218 | Poor 24.0% |
| Immigrants | Burma/Myanmar | 11.6 /100 | #219 | Poor 24.0% |
| Ghanaians | 10.4 /100 | #220 | Poor 24.1% |
| Immigrants | Nicaragua | 9.8 /100 | #221 | Tragic 24.1% |
| Native Hawaiians | 9.3 /100 | #222 | Tragic 24.1% |
| Immigrants | Middle Africa | 8.9 /100 | #223 | Tragic 24.1% |
| Immigrants | Panama | 8.6 /100 | #224 | Tragic 24.1% |
| Bermudans | 8.2 /100 | #225 | Tragic 24.2% |
| Iraqis | 8.1 /100 | #226 | Tragic 24.2% |
| Nigerians | 7.8 /100 | #227 | Tragic 24.2% |
| Whites/Caucasians | 6.6 /100 | #228 | Tragic 24.2% |
| Celtics | 6.4 /100 | #229 | Tragic 24.2% |
| Barbadians | 6.0 /100 | #230 | Tragic 24.3% |
| Immigrants | Thailand | 5.2 /100 | #231 | Tragic 24.3% |
Demographics Similar to Dominicans by Disability Age 65 to 74
In terms of disability age 65 to 74, the demographic groups most similar to Dominicans are Hispanic or Latino (26.7%, a difference of 0.020%), Immigrants from Central America (26.6%, a difference of 0.11%), Blackfeet (26.6%, a difference of 0.28%), Bangladeshi (26.8%, a difference of 0.63%), and Spanish American Indian (26.4%, a difference of 1.2%).
| Demographics | Rating | Rank | Disability Age 65 to 74 |
| Immigrants | Laos | 0.0 /100 | #287 | Tragic 26.1% |
| Mexican American Indians | 0.0 /100 | #288 | Tragic 26.2% |
| Africans | 0.0 /100 | #289 | Tragic 26.2% |
| Immigrants | Cabo Verde | 0.0 /100 | #290 | Tragic 26.3% |
| Spanish American Indians | 0.0 /100 | #291 | Tragic 26.4% |
| Blackfeet | 0.0 /100 | #292 | Tragic 26.6% |
| Immigrants | Central America | 0.0 /100 | #293 | Tragic 26.6% |
| Dominicans | 0.0 /100 | #294 | Tragic 26.7% |
| Hispanics or Latinos | 0.0 /100 | #295 | Tragic 26.7% |
| Bangladeshis | 0.0 /100 | #296 | Tragic 26.8% |
| Fijians | 0.0 /100 | #297 | Tragic 27.0% |
| Immigrants | Yemen | 0.0 /100 | #298 | Tragic 27.0% |
| Potawatomi | 0.0 /100 | #299 | Tragic 27.0% |
| Immigrants | Dominican Republic | 0.0 /100 | #300 | Tragic 27.0% |
| Immigrants | Mexico | 0.0 /100 | #301 | Tragic 27.1% |