Yaqui vs Dominican Disability Age 65 to 74
COMPARE
Yaqui
Dominican
Disability Age 65 to 74
Disability Age 65 to 74 Comparison
Yaqui
Dominicans
27.4%
DISABILITY AGE 65 TO 74
0.0/ 100
METRIC RATING
309th/ 347
METRIC RANK
26.7%
DISABILITY AGE 65 TO 74
0.0/ 100
METRIC RATING
294th/ 347
METRIC RANK
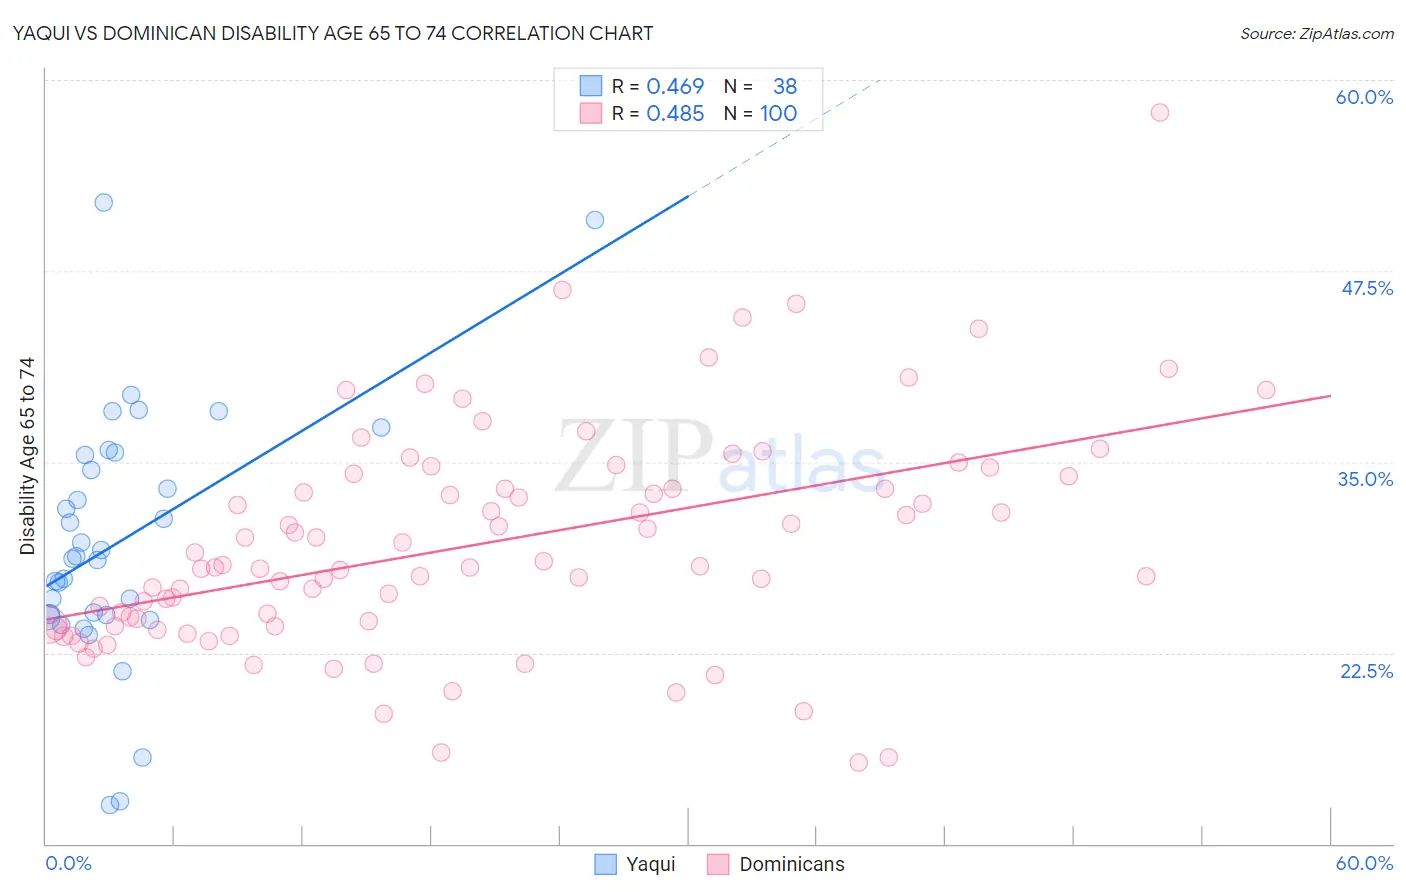
Yaqui vs Dominican Disability Age 65 to 74 Correlation Chart
The statistical analysis conducted on geographies consisting of 107,674,175 people shows a moderate positive correlation between the proportion of Yaqui and percentage of population with a disability between the ages 65 and 75 in the United States with a correlation coefficient (R) of 0.469 and weighted average of 27.4%. Similarly, the statistical analysis conducted on geographies consisting of 354,107,357 people shows a moderate positive correlation between the proportion of Dominicans and percentage of population with a disability between the ages 65 and 75 in the United States with a correlation coefficient (R) of 0.485 and weighted average of 26.7%, a difference of 2.6%.
Disability Age 65 to 74 Correlation Summary
| Measurement | Yaqui | Dominican |
| Minimum | 12.5% | 15.3% |
| Maximum | 52.0% | 57.9% |
| Range | 39.5% | 42.6% |
| Mean | 29.8% | 29.6% |
| Median | 28.7% | 28.1% |
| Interquartile 25% (IQ1) | 25.0% | 24.3% |
| Interquartile 75% (IQ3) | 35.4% | 33.6% |
| Interquartile Range (IQR) | 10.4% | 9.4% |
| Standard Deviation (Sample) | 8.4% | 7.3% |
| Standard Deviation (Population) | 8.2% | 7.2% |
Demographics Similar to Yaqui and Dominicans by Disability Age 65 to 74
In terms of disability age 65 to 74, the demographic groups most similar to Yaqui are Shoshone (27.4%, a difference of 0.050%), Sioux (27.3%, a difference of 0.060%), Ute (27.3%, a difference of 0.21%), Black/African American (27.3%, a difference of 0.27%), and Menominee (27.4%, a difference of 0.27%). Similarly, the demographic groups most similar to Dominicans are Hispanic or Latino (26.7%, a difference of 0.020%), Immigrants from Central America (26.6%, a difference of 0.11%), Blackfeet (26.6%, a difference of 0.28%), Bangladeshi (26.8%, a difference of 0.63%), and Spanish American Indian (26.4%, a difference of 1.2%).
| Demographics | Rating | Rank | Disability Age 65 to 74 |
| Spanish American Indians | 0.0 /100 | #291 | Tragic 26.4% |
| Blackfeet | 0.0 /100 | #292 | Tragic 26.6% |
| Immigrants | Central America | 0.0 /100 | #293 | Tragic 26.6% |
| Dominicans | 0.0 /100 | #294 | Tragic 26.7% |
| Hispanics or Latinos | 0.0 /100 | #295 | Tragic 26.7% |
| Bangladeshis | 0.0 /100 | #296 | Tragic 26.8% |
| Fijians | 0.0 /100 | #297 | Tragic 27.0% |
| Immigrants | Yemen | 0.0 /100 | #298 | Tragic 27.0% |
| Potawatomi | 0.0 /100 | #299 | Tragic 27.0% |
| Immigrants | Dominican Republic | 0.0 /100 | #300 | Tragic 27.0% |
| Immigrants | Mexico | 0.0 /100 | #301 | Tragic 27.1% |
| Central American Indians | 0.0 /100 | #302 | Tragic 27.1% |
| Tlingit-Haida | 0.0 /100 | #303 | Tragic 27.1% |
| Puget Sound Salish | 0.0 /100 | #304 | Tragic 27.2% |
| Mexicans | 0.0 /100 | #305 | Tragic 27.2% |
| Blacks/African Americans | 0.0 /100 | #306 | Tragic 27.3% |
| Ute | 0.0 /100 | #307 | Tragic 27.3% |
| Sioux | 0.0 /100 | #308 | Tragic 27.3% |
| Yaqui | 0.0 /100 | #309 | Tragic 27.4% |
| Shoshone | 0.0 /100 | #310 | Tragic 27.4% |
| Menominee | 0.0 /100 | #311 | Tragic 27.4% |