Immigrants from Venezuela vs Dominican Disability Age 65 to 74
COMPARE
Immigrants from Venezuela
Dominican
Disability Age 65 to 74
Disability Age 65 to 74 Comparison
Immigrants from Venezuela
Dominicans
21.8%
DISABILITY AGE 65 TO 74
99.0/ 100
METRIC RATING
73rd/ 347
METRIC RANK
26.7%
DISABILITY AGE 65 TO 74
0.0/ 100
METRIC RATING
294th/ 347
METRIC RANK
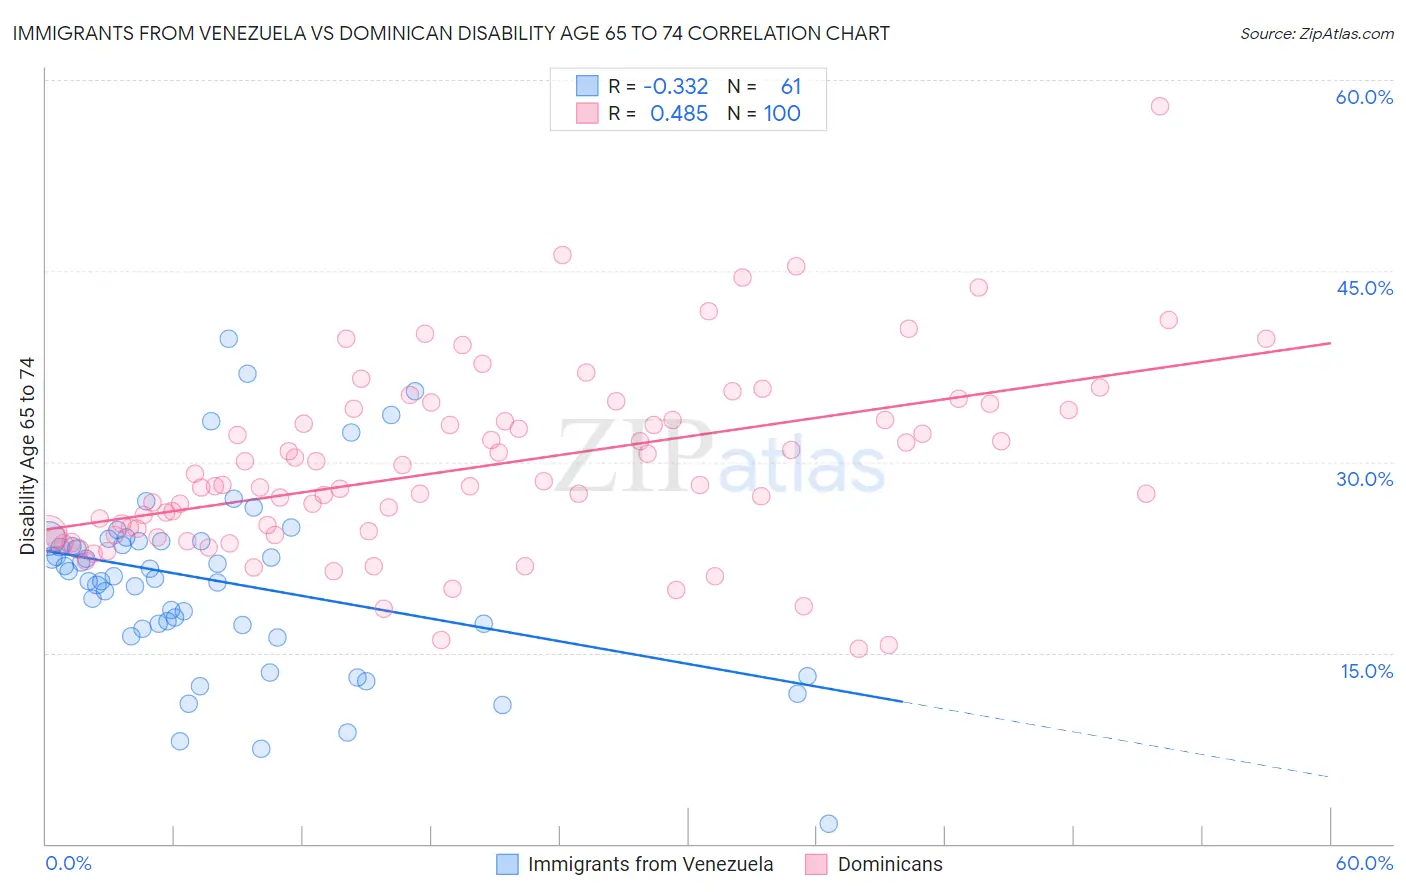
Immigrants from Venezuela vs Dominican Disability Age 65 to 74 Correlation Chart
The statistical analysis conducted on geographies consisting of 287,548,772 people shows a mild negative correlation between the proportion of Immigrants from Venezuela and percentage of population with a disability between the ages 65 and 75 in the United States with a correlation coefficient (R) of -0.332 and weighted average of 21.8%. Similarly, the statistical analysis conducted on geographies consisting of 354,107,357 people shows a moderate positive correlation between the proportion of Dominicans and percentage of population with a disability between the ages 65 and 75 in the United States with a correlation coefficient (R) of 0.485 and weighted average of 26.7%, a difference of 22.6%.
Disability Age 65 to 74 Correlation Summary
| Measurement | Immigrants from Venezuela | Dominican |
| Minimum | 1.6% | 15.3% |
| Maximum | 39.7% | 57.9% |
| Range | 38.1% | 42.6% |
| Mean | 20.6% | 29.6% |
| Median | 21.0% | 28.1% |
| Interquartile 25% (IQ1) | 17.0% | 24.3% |
| Interquartile 75% (IQ3) | 23.8% | 33.6% |
| Interquartile Range (IQR) | 6.8% | 9.4% |
| Standard Deviation (Sample) | 7.2% | 7.3% |
| Standard Deviation (Population) | 7.1% | 7.2% |
Similar Demographics by Disability Age 65 to 74
Demographics Similar to Immigrants from Venezuela by Disability Age 65 to 74
In terms of disability age 65 to 74, the demographic groups most similar to Immigrants from Venezuela are Cambodian (21.8%, a difference of 0.010%), Mongolian (21.8%, a difference of 0.030%), Greek (21.8%, a difference of 0.040%), Immigrants from Poland (21.8%, a difference of 0.090%), and Immigrants from Eastern Europe (21.8%, a difference of 0.15%).
| Demographics | Rating | Rank | Disability Age 65 to 74 |
| Maltese | 99.4 /100 | #66 | Exceptional 21.6% |
| Immigrants | South Africa | 99.3 /100 | #67 | Exceptional 21.7% |
| Immigrants | Scotland | 99.3 /100 | #68 | Exceptional 21.7% |
| Immigrants | Egypt | 99.2 /100 | #69 | Exceptional 21.7% |
| Chinese | 99.2 /100 | #70 | Exceptional 21.7% |
| Immigrants | Belarus | 99.2 /100 | #71 | Exceptional 21.7% |
| Immigrants | Hungary | 99.2 /100 | #72 | Exceptional 21.7% |
| Immigrants | Venezuela | 99.0 /100 | #73 | Exceptional 21.8% |
| Cambodians | 99.0 /100 | #74 | Exceptional 21.8% |
| Mongolians | 99.0 /100 | #75 | Exceptional 21.8% |
| Greeks | 99.0 /100 | #76 | Exceptional 21.8% |
| Immigrants | Poland | 99.0 /100 | #77 | Exceptional 21.8% |
| Immigrants | Eastern Europe | 99.0 /100 | #78 | Exceptional 21.8% |
| Venezuelans | 99.0 /100 | #79 | Exceptional 21.8% |
| Immigrants | Norway | 98.9 /100 | #80 | Exceptional 21.8% |
Demographics Similar to Dominicans by Disability Age 65 to 74
In terms of disability age 65 to 74, the demographic groups most similar to Dominicans are Hispanic or Latino (26.7%, a difference of 0.020%), Immigrants from Central America (26.6%, a difference of 0.11%), Blackfeet (26.6%, a difference of 0.28%), Bangladeshi (26.8%, a difference of 0.63%), and Spanish American Indian (26.4%, a difference of 1.2%).
| Demographics | Rating | Rank | Disability Age 65 to 74 |
| Immigrants | Laos | 0.0 /100 | #287 | Tragic 26.1% |
| Mexican American Indians | 0.0 /100 | #288 | Tragic 26.2% |
| Africans | 0.0 /100 | #289 | Tragic 26.2% |
| Immigrants | Cabo Verde | 0.0 /100 | #290 | Tragic 26.3% |
| Spanish American Indians | 0.0 /100 | #291 | Tragic 26.4% |
| Blackfeet | 0.0 /100 | #292 | Tragic 26.6% |
| Immigrants | Central America | 0.0 /100 | #293 | Tragic 26.6% |
| Dominicans | 0.0 /100 | #294 | Tragic 26.7% |
| Hispanics or Latinos | 0.0 /100 | #295 | Tragic 26.7% |
| Bangladeshis | 0.0 /100 | #296 | Tragic 26.8% |
| Fijians | 0.0 /100 | #297 | Tragic 27.0% |
| Immigrants | Yemen | 0.0 /100 | #298 | Tragic 27.0% |
| Potawatomi | 0.0 /100 | #299 | Tragic 27.0% |
| Immigrants | Dominican Republic | 0.0 /100 | #300 | Tragic 27.0% |
| Immigrants | Mexico | 0.0 /100 | #301 | Tragic 27.1% |