Scotch-Irish vs Sudanese Disability Age 18 to 34
COMPARE
Scotch-Irish
Sudanese
Disability Age 18 to 34
Disability Age 18 to 34 Comparison
Scotch-Irish
Sudanese
7.8%
DISABILITY AGE 18 TO 34
0.0/ 100
METRIC RATING
307th/ 347
METRIC RANK
6.9%
DISABILITY AGE 18 TO 34
7.0/ 100
METRIC RATING
216th/ 347
METRIC RANK
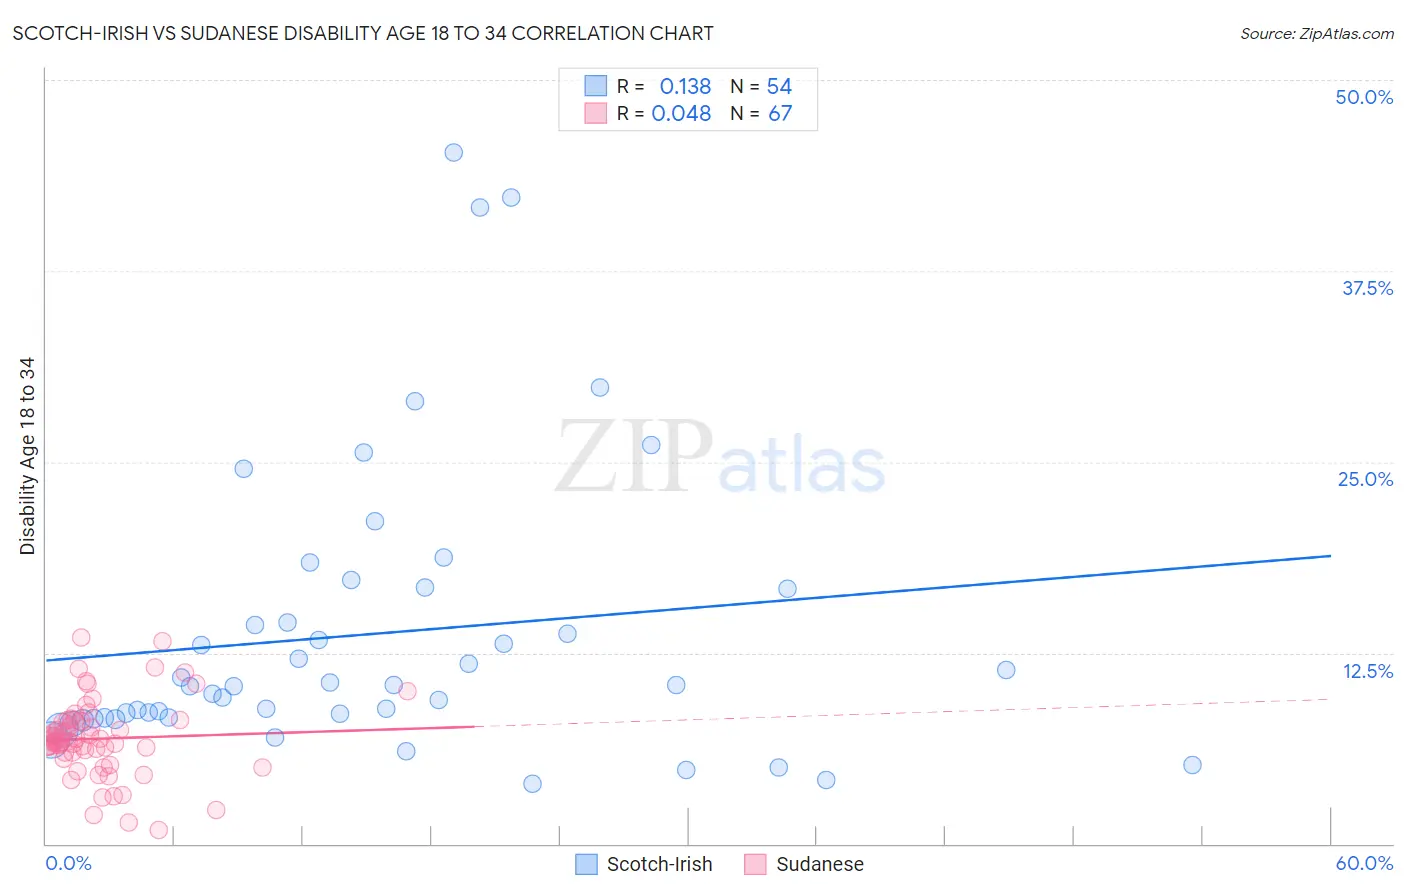
Scotch-Irish vs Sudanese Disability Age 18 to 34 Correlation Chart
The statistical analysis conducted on geographies consisting of 544,079,261 people shows a poor positive correlation between the proportion of Scotch-Irish and percentage of population with a disability between the ages 18 and 35 in the United States with a correlation coefficient (R) of 0.138 and weighted average of 7.8%. Similarly, the statistical analysis conducted on geographies consisting of 110,108,179 people shows no correlation between the proportion of Sudanese and percentage of population with a disability between the ages 18 and 35 in the United States with a correlation coefficient (R) of 0.048 and weighted average of 6.9%, a difference of 13.2%.
Disability Age 18 to 34 Correlation Summary
| Measurement | Scotch-Irish | Sudanese |
| Minimum | 3.9% | 0.92% |
| Maximum | 45.2% | 13.5% |
| Range | 41.3% | 12.6% |
| Mean | 13.7% | 6.9% |
| Median | 10.4% | 6.7% |
| Interquartile 25% (IQ1) | 8.2% | 6.0% |
| Interquartile 75% (IQ3) | 16.7% | 8.1% |
| Interquartile Range (IQR) | 8.4% | 2.1% |
| Standard Deviation (Sample) | 9.4% | 2.5% |
| Standard Deviation (Population) | 9.4% | 2.5% |
Similar Demographics by Disability Age 18 to 34
Demographics Similar to Scotch-Irish by Disability Age 18 to 34
In terms of disability age 18 to 34, the demographic groups most similar to Scotch-Irish are Pennsylvania German (7.8%, a difference of 0.030%), Alaska Native (7.8%, a difference of 0.040%), Finnish (7.8%, a difference of 0.10%), English (7.8%, a difference of 0.26%), and Menominee (7.8%, a difference of 0.34%).
| Demographics | Rating | Rank | Disability Age 18 to 34 |
| Scottish | 0.0 /100 | #300 | Tragic 7.7% |
| Pima | 0.0 /100 | #301 | Tragic 7.7% |
| Welsh | 0.0 /100 | #302 | Tragic 7.7% |
| Cheyenne | 0.0 /100 | #303 | Tragic 7.7% |
| Shoshone | 0.0 /100 | #304 | Tragic 7.8% |
| Menominee | 0.0 /100 | #305 | Tragic 7.8% |
| English | 0.0 /100 | #306 | Tragic 7.8% |
| Scotch-Irish | 0.0 /100 | #307 | Tragic 7.8% |
| Pennsylvania Germans | 0.0 /100 | #308 | Tragic 7.8% |
| Alaska Natives | 0.0 /100 | #309 | Tragic 7.8% |
| Finns | 0.0 /100 | #310 | Tragic 7.8% |
| French | 0.0 /100 | #311 | Tragic 7.9% |
| Spanish Americans | 0.0 /100 | #312 | Tragic 7.9% |
| Iroquois | 0.0 /100 | #313 | Tragic 7.9% |
| Colville | 0.0 /100 | #314 | Tragic 7.9% |
Demographics Similar to Sudanese by Disability Age 18 to 34
In terms of disability age 18 to 34, the demographic groups most similar to Sudanese are Immigrants from Kenya (6.9%, a difference of 0.020%), Ukrainian (6.9%, a difference of 0.070%), Immigrants from Thailand (6.9%, a difference of 0.13%), Hawaiian (6.9%, a difference of 0.14%), and Serbian (6.9%, a difference of 0.29%).
| Demographics | Rating | Rank | Disability Age 18 to 34 |
| Immigrants | Burma/Myanmar | 12.3 /100 | #209 | Poor 6.8% |
| Latvians | 11.1 /100 | #210 | Poor 6.8% |
| Immigrants | Norway | 10.0 /100 | #211 | Tragic 6.8% |
| Luxembourgers | 9.4 /100 | #212 | Tragic 6.9% |
| Immigrants | Western Europe | 9.1 /100 | #213 | Tragic 6.9% |
| Serbians | 8.2 /100 | #214 | Tragic 6.9% |
| Immigrants | Thailand | 7.5 /100 | #215 | Tragic 6.9% |
| Sudanese | 7.0 /100 | #216 | Tragic 6.9% |
| Immigrants | Kenya | 6.9 /100 | #217 | Tragic 6.9% |
| Ukrainians | 6.7 /100 | #218 | Tragic 6.9% |
| Hawaiians | 6.5 /100 | #219 | Tragic 6.9% |
| Immigrants | Senegal | 5.5 /100 | #220 | Tragic 6.9% |
| Immigrants | Middle Africa | 5.5 /100 | #221 | Tragic 6.9% |
| Immigrants | England | 5.3 /100 | #222 | Tragic 6.9% |
| Carpatho Rusyns | 5.2 /100 | #223 | Tragic 6.9% |