Scotch-Irish vs Panamanian Disability Age 18 to 34
COMPARE
Scotch-Irish
Panamanian
Disability Age 18 to 34
Disability Age 18 to 34 Comparison
Scotch-Irish
Panamanians
7.8%
DISABILITY AGE 18 TO 34
0.0/ 100
METRIC RATING
307th/ 347
METRIC RANK
6.8%
DISABILITY AGE 18 TO 34
15.8/ 100
METRIC RATING
202nd/ 347
METRIC RANK
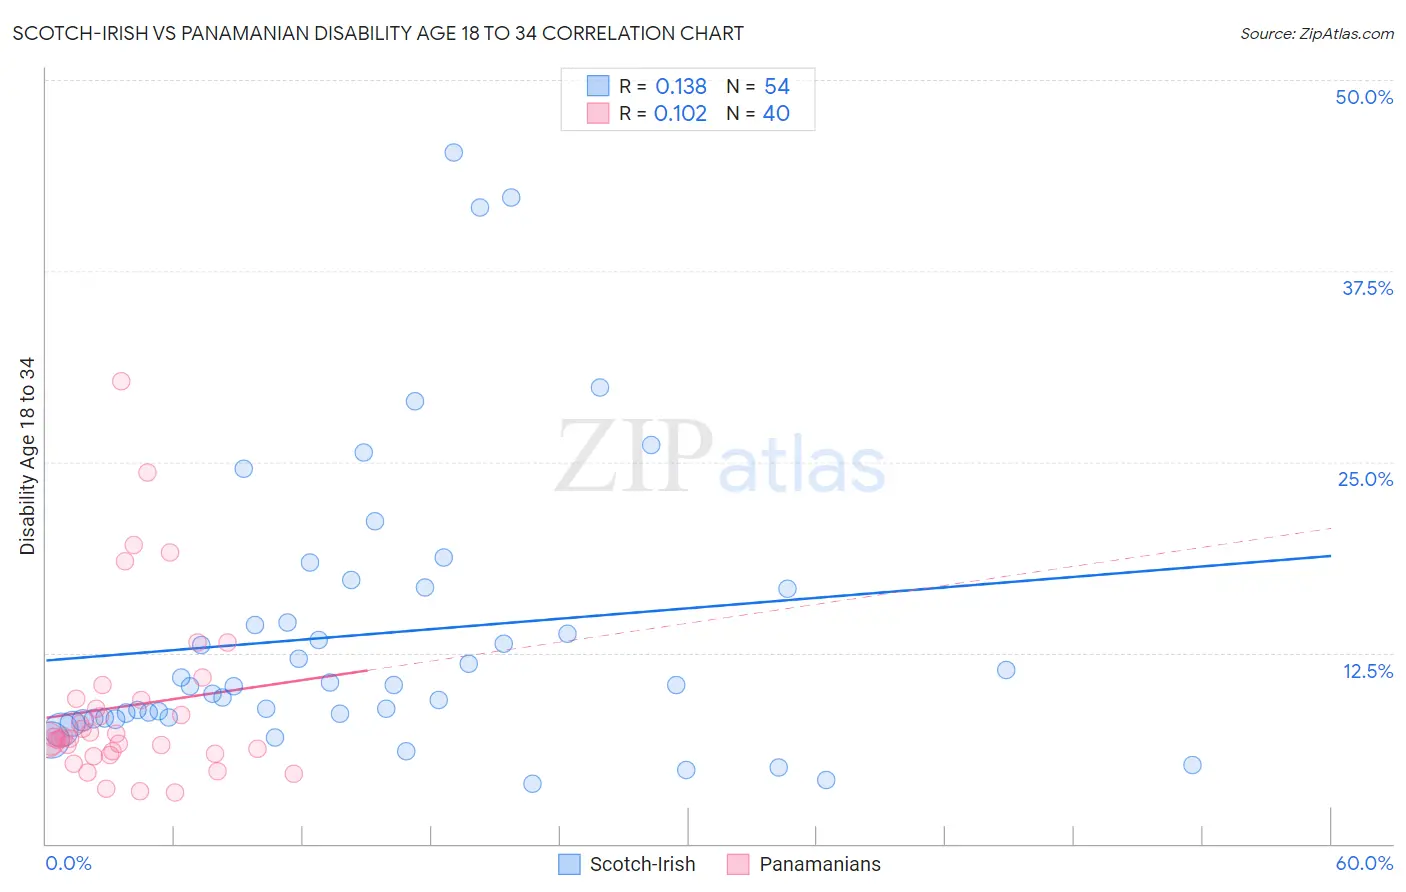
Scotch-Irish vs Panamanian Disability Age 18 to 34 Correlation Chart
The statistical analysis conducted on geographies consisting of 544,079,261 people shows a poor positive correlation between the proportion of Scotch-Irish and percentage of population with a disability between the ages 18 and 35 in the United States with a correlation coefficient (R) of 0.138 and weighted average of 7.8%. Similarly, the statistical analysis conducted on geographies consisting of 280,999,294 people shows a poor positive correlation between the proportion of Panamanians and percentage of population with a disability between the ages 18 and 35 in the United States with a correlation coefficient (R) of 0.102 and weighted average of 6.8%, a difference of 14.9%.
Disability Age 18 to 34 Correlation Summary
| Measurement | Scotch-Irish | Panamanian |
| Minimum | 3.9% | 3.4% |
| Maximum | 45.2% | 30.3% |
| Range | 41.3% | 26.9% |
| Mean | 13.7% | 9.0% |
| Median | 10.4% | 6.9% |
| Interquartile 25% (IQ1) | 8.2% | 6.0% |
| Interquartile 75% (IQ3) | 16.7% | 9.4% |
| Interquartile Range (IQR) | 8.4% | 3.5% |
| Standard Deviation (Sample) | 9.4% | 5.8% |
| Standard Deviation (Population) | 9.4% | 5.7% |
Similar Demographics by Disability Age 18 to 34
Demographics Similar to Scotch-Irish by Disability Age 18 to 34
In terms of disability age 18 to 34, the demographic groups most similar to Scotch-Irish are Pennsylvania German (7.8%, a difference of 0.030%), Alaska Native (7.8%, a difference of 0.040%), Finnish (7.8%, a difference of 0.10%), English (7.8%, a difference of 0.26%), and Menominee (7.8%, a difference of 0.34%).
| Demographics | Rating | Rank | Disability Age 18 to 34 |
| Scottish | 0.0 /100 | #300 | Tragic 7.7% |
| Pima | 0.0 /100 | #301 | Tragic 7.7% |
| Welsh | 0.0 /100 | #302 | Tragic 7.7% |
| Cheyenne | 0.0 /100 | #303 | Tragic 7.7% |
| Shoshone | 0.0 /100 | #304 | Tragic 7.8% |
| Menominee | 0.0 /100 | #305 | Tragic 7.8% |
| English | 0.0 /100 | #306 | Tragic 7.8% |
| Scotch-Irish | 0.0 /100 | #307 | Tragic 7.8% |
| Pennsylvania Germans | 0.0 /100 | #308 | Tragic 7.8% |
| Alaska Natives | 0.0 /100 | #309 | Tragic 7.8% |
| Finns | 0.0 /100 | #310 | Tragic 7.8% |
| French | 0.0 /100 | #311 | Tragic 7.9% |
| Spanish Americans | 0.0 /100 | #312 | Tragic 7.9% |
| Iroquois | 0.0 /100 | #313 | Tragic 7.9% |
| Colville | 0.0 /100 | #314 | Tragic 7.9% |
Demographics Similar to Panamanians by Disability Age 18 to 34
In terms of disability age 18 to 34, the demographic groups most similar to Panamanians are Greek (6.8%, a difference of 0.040%), Sierra Leonean (6.8%, a difference of 0.21%), Hispanic or Latino (6.8%, a difference of 0.26%), Immigrants from Bosnia and Herzegovina (6.8%, a difference of 0.29%), and Kenyan (6.8%, a difference of 0.30%).
| Demographics | Rating | Rank | Disability Age 18 to 34 |
| Mexican American Indians | 22.3 /100 | #195 | Fair 6.7% |
| Immigrants | Netherlands | 21.0 /100 | #196 | Fair 6.7% |
| Estonians | 20.6 /100 | #197 | Fair 6.8% |
| Australians | 19.4 /100 | #198 | Poor 6.8% |
| Kenyans | 18.3 /100 | #199 | Poor 6.8% |
| Sierra Leoneans | 17.5 /100 | #200 | Poor 6.8% |
| Greeks | 16.1 /100 | #201 | Poor 6.8% |
| Panamanians | 15.8 /100 | #202 | Poor 6.8% |
| Hispanics or Latinos | 13.8 /100 | #203 | Poor 6.8% |
| Immigrants | Bosnia and Herzegovina | 13.6 /100 | #204 | Poor 6.8% |
| Lebanese | 13.3 /100 | #205 | Poor 6.8% |
| Japanese | 12.8 /100 | #206 | Poor 6.8% |
| Mexicans | 12.6 /100 | #207 | Poor 6.8% |
| Immigrants | Scotland | 12.4 /100 | #208 | Poor 6.8% |
| Immigrants | Burma/Myanmar | 12.3 /100 | #209 | Poor 6.8% |