Scotch-Irish vs Liberian Disability Age 18 to 34
COMPARE
Scotch-Irish
Liberian
Disability Age 18 to 34
Disability Age 18 to 34 Comparison
Scotch-Irish
Liberians
7.8%
DISABILITY AGE 18 TO 34
0.0/ 100
METRIC RATING
307th/ 347
METRIC RANK
7.1%
DISABILITY AGE 18 TO 34
1.5/ 100
METRIC RATING
236th/ 347
METRIC RANK
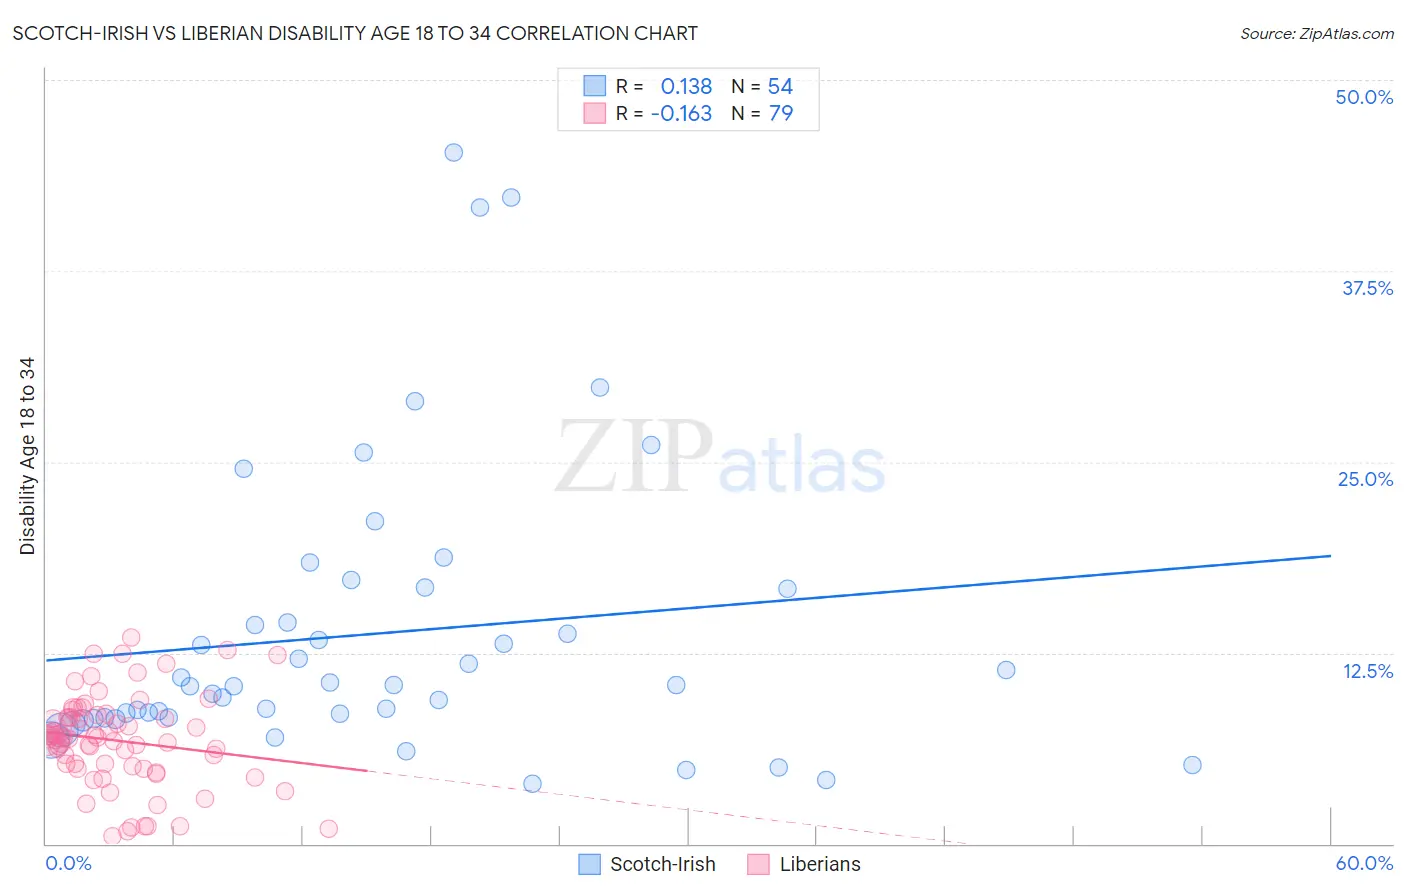
Scotch-Irish vs Liberian Disability Age 18 to 34 Correlation Chart
The statistical analysis conducted on geographies consisting of 544,079,261 people shows a poor positive correlation between the proportion of Scotch-Irish and percentage of population with a disability between the ages 18 and 35 in the United States with a correlation coefficient (R) of 0.138 and weighted average of 7.8%. Similarly, the statistical analysis conducted on geographies consisting of 118,043,713 people shows a poor negative correlation between the proportion of Liberians and percentage of population with a disability between the ages 18 and 35 in the United States with a correlation coefficient (R) of -0.163 and weighted average of 7.1%, a difference of 10.2%.
Disability Age 18 to 34 Correlation Summary
| Measurement | Scotch-Irish | Liberian |
| Minimum | 3.9% | 0.47% |
| Maximum | 45.2% | 13.5% |
| Range | 41.3% | 13.0% |
| Mean | 13.7% | 6.8% |
| Median | 10.4% | 7.0% |
| Interquartile 25% (IQ1) | 8.2% | 5.0% |
| Interquartile 75% (IQ3) | 16.7% | 8.3% |
| Interquartile Range (IQR) | 8.4% | 3.3% |
| Standard Deviation (Sample) | 9.4% | 3.0% |
| Standard Deviation (Population) | 9.4% | 2.9% |
Similar Demographics by Disability Age 18 to 34
Demographics Similar to Scotch-Irish by Disability Age 18 to 34
In terms of disability age 18 to 34, the demographic groups most similar to Scotch-Irish are Pennsylvania German (7.8%, a difference of 0.030%), Alaska Native (7.8%, a difference of 0.040%), Finnish (7.8%, a difference of 0.10%), English (7.8%, a difference of 0.26%), and Menominee (7.8%, a difference of 0.34%).
| Demographics | Rating | Rank | Disability Age 18 to 34 |
| Scottish | 0.0 /100 | #300 | Tragic 7.7% |
| Pima | 0.0 /100 | #301 | Tragic 7.7% |
| Welsh | 0.0 /100 | #302 | Tragic 7.7% |
| Cheyenne | 0.0 /100 | #303 | Tragic 7.7% |
| Shoshone | 0.0 /100 | #304 | Tragic 7.8% |
| Menominee | 0.0 /100 | #305 | Tragic 7.8% |
| English | 0.0 /100 | #306 | Tragic 7.8% |
| Scotch-Irish | 0.0 /100 | #307 | Tragic 7.8% |
| Pennsylvania Germans | 0.0 /100 | #308 | Tragic 7.8% |
| Alaska Natives | 0.0 /100 | #309 | Tragic 7.8% |
| Finns | 0.0 /100 | #310 | Tragic 7.8% |
| French | 0.0 /100 | #311 | Tragic 7.9% |
| Spanish Americans | 0.0 /100 | #312 | Tragic 7.9% |
| Iroquois | 0.0 /100 | #313 | Tragic 7.9% |
| Colville | 0.0 /100 | #314 | Tragic 7.9% |
Demographics Similar to Liberians by Disability Age 18 to 34
In terms of disability age 18 to 34, the demographic groups most similar to Liberians are Austrian (7.1%, a difference of 0.17%), Marshallese (7.1%, a difference of 0.22%), Subsaharan African (7.1%, a difference of 0.25%), Italian (7.1%, a difference of 0.33%), and Arapaho (7.1%, a difference of 0.45%).
| Demographics | Rating | Rank | Disability Age 18 to 34 |
| Lithuanians | 4.1 /100 | #229 | Tragic 7.0% |
| Immigrants | North America | 3.9 /100 | #230 | Tragic 7.0% |
| Ute | 3.8 /100 | #231 | Tragic 7.0% |
| Samoans | 3.2 /100 | #232 | Tragic 7.0% |
| New Zealanders | 2.7 /100 | #233 | Tragic 7.0% |
| Alsatians | 2.1 /100 | #234 | Tragic 7.0% |
| Sub-Saharan Africans | 1.7 /100 | #235 | Tragic 7.1% |
| Liberians | 1.5 /100 | #236 | Tragic 7.1% |
| Austrians | 1.3 /100 | #237 | Tragic 7.1% |
| Marshallese | 1.3 /100 | #238 | Tragic 7.1% |
| Italians | 1.2 /100 | #239 | Tragic 7.1% |
| Arapaho | 1.1 /100 | #240 | Tragic 7.1% |
| Nepalese | 1.1 /100 | #241 | Tragic 7.1% |
| Immigrants | Congo | 1.1 /100 | #242 | Tragic 7.1% |
| Icelanders | 1.0 /100 | #243 | Tragic 7.1% |