Scotch-Irish vs Bulgarian Disability Age 18 to 34
COMPARE
Scotch-Irish
Bulgarian
Disability Age 18 to 34
Disability Age 18 to 34 Comparison
Scotch-Irish
Bulgarians
7.8%
DISABILITY AGE 18 TO 34
0.0/ 100
METRIC RATING
307th/ 347
METRIC RANK
6.5%
DISABILITY AGE 18 TO 34
78.3/ 100
METRIC RATING
152nd/ 347
METRIC RANK
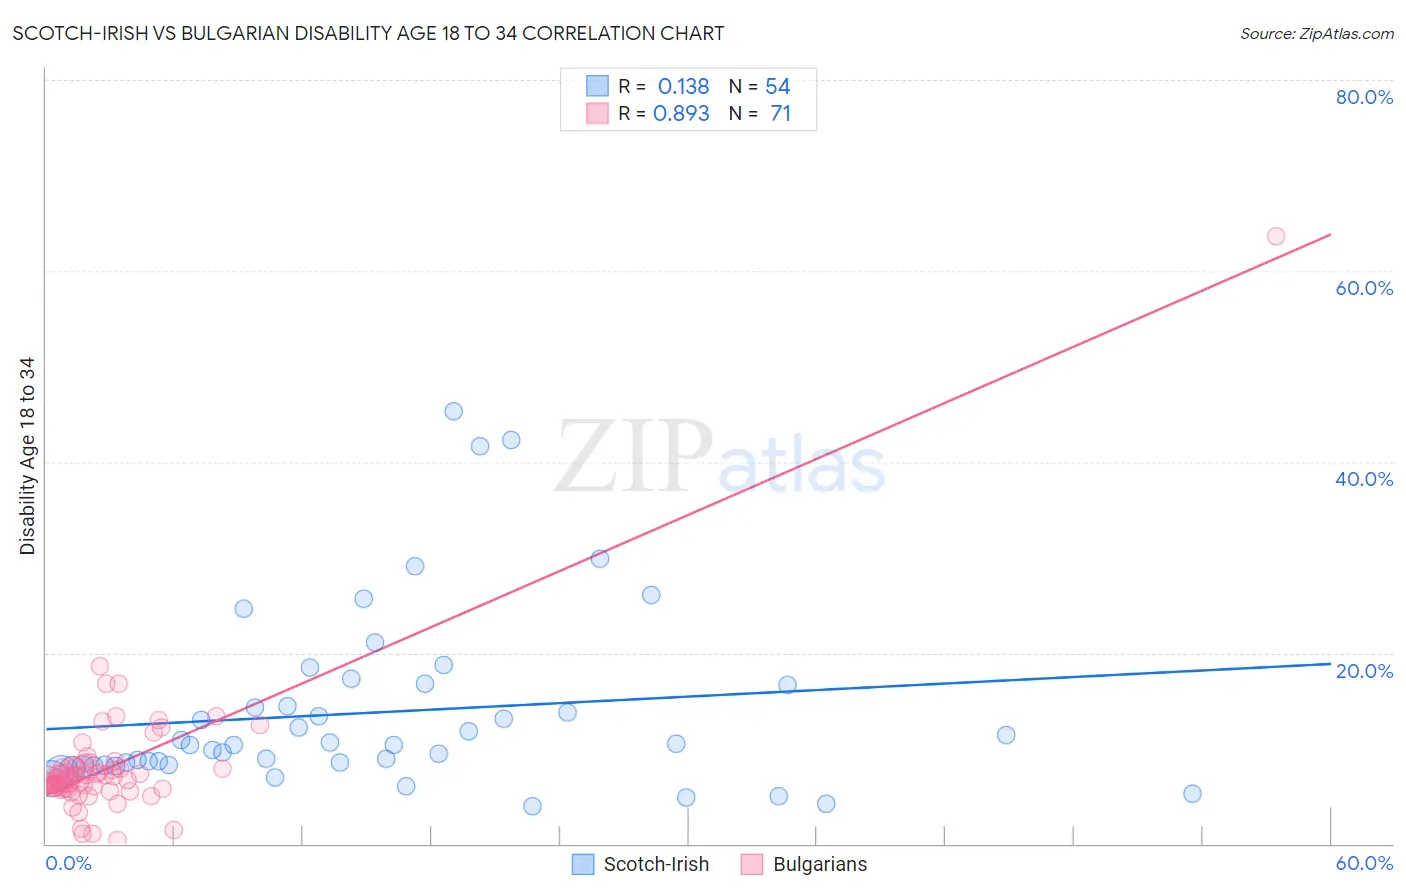
Scotch-Irish vs Bulgarian Disability Age 18 to 34 Correlation Chart
The statistical analysis conducted on geographies consisting of 544,079,261 people shows a poor positive correlation between the proportion of Scotch-Irish and percentage of population with a disability between the ages 18 and 35 in the United States with a correlation coefficient (R) of 0.138 and weighted average of 7.8%. Similarly, the statistical analysis conducted on geographies consisting of 205,383,127 people shows a very strong positive correlation between the proportion of Bulgarians and percentage of population with a disability between the ages 18 and 35 in the United States with a correlation coefficient (R) of 0.893 and weighted average of 6.5%, a difference of 21.0%.
Disability Age 18 to 34 Correlation Summary
| Measurement | Scotch-Irish | Bulgarian |
| Minimum | 3.9% | 0.34% |
| Maximum | 45.2% | 63.6% |
| Range | 41.3% | 63.3% |
| Mean | 13.7% | 8.1% |
| Median | 10.4% | 6.7% |
| Interquartile 25% (IQ1) | 8.2% | 5.8% |
| Interquartile 75% (IQ3) | 16.7% | 8.1% |
| Interquartile Range (IQR) | 8.4% | 2.3% |
| Standard Deviation (Sample) | 9.4% | 7.5% |
| Standard Deviation (Population) | 9.4% | 7.5% |
Similar Demographics by Disability Age 18 to 34
Demographics Similar to Scotch-Irish by Disability Age 18 to 34
In terms of disability age 18 to 34, the demographic groups most similar to Scotch-Irish are Pennsylvania German (7.8%, a difference of 0.030%), Alaska Native (7.8%, a difference of 0.040%), Finnish (7.8%, a difference of 0.10%), English (7.8%, a difference of 0.26%), and Menominee (7.8%, a difference of 0.34%).
| Demographics | Rating | Rank | Disability Age 18 to 34 |
| Scottish | 0.0 /100 | #300 | Tragic 7.7% |
| Pima | 0.0 /100 | #301 | Tragic 7.7% |
| Welsh | 0.0 /100 | #302 | Tragic 7.7% |
| Cheyenne | 0.0 /100 | #303 | Tragic 7.7% |
| Shoshone | 0.0 /100 | #304 | Tragic 7.8% |
| Menominee | 0.0 /100 | #305 | Tragic 7.8% |
| English | 0.0 /100 | #306 | Tragic 7.8% |
| Scotch-Irish | 0.0 /100 | #307 | Tragic 7.8% |
| Pennsylvania Germans | 0.0 /100 | #308 | Tragic 7.8% |
| Alaska Natives | 0.0 /100 | #309 | Tragic 7.8% |
| Finns | 0.0 /100 | #310 | Tragic 7.8% |
| French | 0.0 /100 | #311 | Tragic 7.9% |
| Spanish Americans | 0.0 /100 | #312 | Tragic 7.9% |
| Iroquois | 0.0 /100 | #313 | Tragic 7.9% |
| Colville | 0.0 /100 | #314 | Tragic 7.9% |
Demographics Similar to Bulgarians by Disability Age 18 to 34
In terms of disability age 18 to 34, the demographic groups most similar to Bulgarians are Immigrants from Eritrea (6.5%, a difference of 0.090%), Immigrants from Central America (6.5%, a difference of 0.16%), Inupiat (6.5%, a difference of 0.16%), Immigrants from Panama (6.5%, a difference of 0.29%), and Immigrants from Sierra Leone (6.5%, a difference of 0.32%).
| Demographics | Rating | Rank | Disability Age 18 to 34 |
| Moroccans | 85.2 /100 | #145 | Excellent 6.4% |
| Belizeans | 84.9 /100 | #146 | Excellent 6.4% |
| Immigrants | South Africa | 83.7 /100 | #147 | Excellent 6.4% |
| Immigrants | Belgium | 83.5 /100 | #148 | Excellent 6.4% |
| Hondurans | 83.1 /100 | #149 | Excellent 6.4% |
| Immigrants | Dominican Republic | 82.7 /100 | #150 | Excellent 6.4% |
| Tongans | 81.9 /100 | #151 | Excellent 6.4% |
| Bulgarians | 78.3 /100 | #152 | Good 6.5% |
| Immigrants | Eritrea | 77.4 /100 | #153 | Good 6.5% |
| Immigrants | Central America | 76.8 /100 | #154 | Good 6.5% |
| Inupiat | 76.7 /100 | #155 | Good 6.5% |
| Immigrants | Panama | 75.3 /100 | #156 | Good 6.5% |
| Immigrants | Sierra Leone | 75.0 /100 | #157 | Good 6.5% |
| Zimbabweans | 74.7 /100 | #158 | Good 6.5% |
| Dominicans | 73.6 /100 | #159 | Good 6.5% |