Scotch-Irish vs Sudanese Professional Degree
COMPARE
Scotch-Irish
Sudanese
Professional Degree
Professional Degree Comparison
Scotch-Irish
Sudanese
4.3%
PROFESSIONAL DEGREE
34.2/ 100
METRIC RATING
186th/ 347
METRIC RANK
4.6%
PROFESSIONAL DEGREE
81.3/ 100
METRIC RATING
142nd/ 347
METRIC RANK
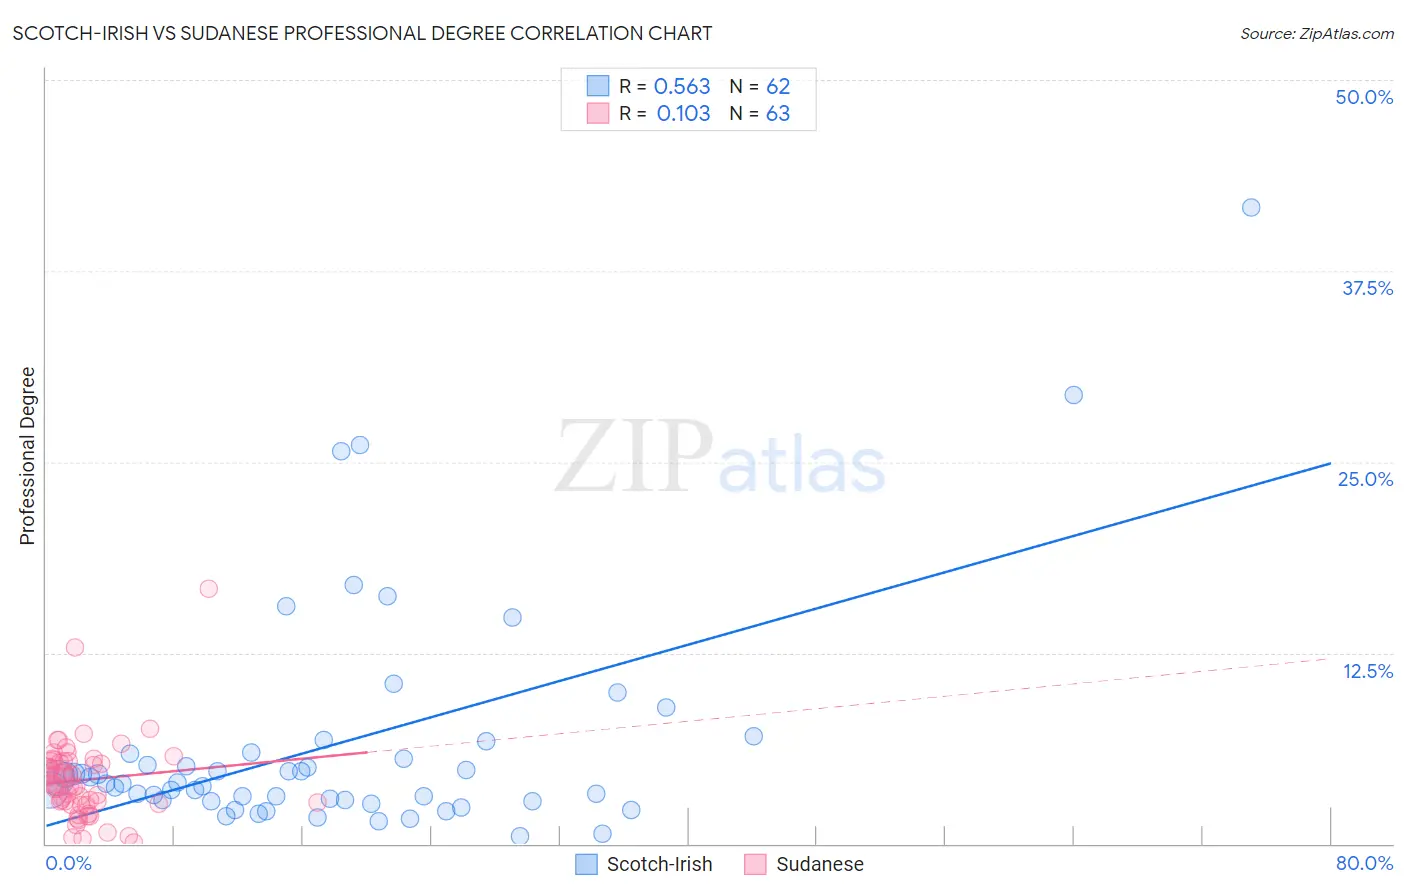
Scotch-Irish vs Sudanese Professional Degree Correlation Chart
The statistical analysis conducted on geographies consisting of 542,187,635 people shows a substantial positive correlation between the proportion of Scotch-Irish and percentage of population with at least professional degree education in the United States with a correlation coefficient (R) of 0.563 and weighted average of 4.3%. Similarly, the statistical analysis conducted on geographies consisting of 110,066,536 people shows a poor positive correlation between the proportion of Sudanese and percentage of population with at least professional degree education in the United States with a correlation coefficient (R) of 0.103 and weighted average of 4.6%, a difference of 7.9%.
Professional Degree Correlation Summary
| Measurement | Scotch-Irish | Sudanese |
| Minimum | 0.53% | 0.061% |
| Maximum | 41.7% | 16.7% |
| Range | 41.1% | 16.7% |
| Mean | 6.5% | 4.2% |
| Median | 4.0% | 3.8% |
| Interquartile 25% (IQ1) | 2.8% | 2.6% |
| Interquartile 75% (IQ3) | 5.9% | 5.4% |
| Interquartile Range (IQR) | 3.0% | 2.8% |
| Standard Deviation (Sample) | 7.5% | 2.7% |
| Standard Deviation (Population) | 7.4% | 2.7% |
Similar Demographics by Professional Degree
Demographics Similar to Scotch-Irish by Professional Degree
In terms of professional degree, the demographic groups most similar to Scotch-Irish are Immigrants from Cameroon (4.3%, a difference of 0.15%), Welsh (4.3%, a difference of 0.27%), Belgian (4.3%, a difference of 0.32%), Immigrants from Thailand (4.3%, a difference of 0.43%), and Slovak (4.3%, a difference of 0.60%).
| Demographics | Rating | Rank | Professional Degree |
| Immigrants | Kenya | 45.9 /100 | #179 | Average 4.4% |
| Czechs | 44.9 /100 | #180 | Average 4.4% |
| Danes | 43.5 /100 | #181 | Average 4.4% |
| Immigrants | Immigrants | 43.2 /100 | #182 | Average 4.4% |
| Bermudans | 43.1 /100 | #183 | Average 4.4% |
| Belgians | 36.2 /100 | #184 | Fair 4.3% |
| Welsh | 35.8 /100 | #185 | Fair 4.3% |
| Scotch-Irish | 34.2 /100 | #186 | Fair 4.3% |
| Immigrants | Cameroon | 33.3 /100 | #187 | Fair 4.3% |
| Immigrants | Thailand | 31.7 /100 | #188 | Fair 4.3% |
| Slovaks | 30.7 /100 | #189 | Fair 4.3% |
| Immigrants | Poland | 29.2 /100 | #190 | Fair 4.3% |
| Sri Lankans | 29.0 /100 | #191 | Fair 4.3% |
| Ghanaians | 27.3 /100 | #192 | Fair 4.3% |
| French | 27.1 /100 | #193 | Fair 4.2% |
Demographics Similar to Sudanese by Professional Degree
In terms of professional degree, the demographic groups most similar to Sudanese are Hungarian (4.6%, a difference of 0.11%), Basque (4.6%, a difference of 0.13%), Immigrants from South America (4.6%, a difference of 0.18%), Uruguayan (4.6%, a difference of 0.24%), and Luxembourger (4.6%, a difference of 0.55%).
| Demographics | Rating | Rank | Professional Degree |
| Macedonians | 89.8 /100 | #135 | Excellent 4.8% |
| Immigrants | Jordan | 89.0 /100 | #136 | Excellent 4.7% |
| Jordanians | 88.9 /100 | #137 | Excellent 4.7% |
| Afghans | 88.8 /100 | #138 | Excellent 4.7% |
| South Americans | 85.6 /100 | #139 | Excellent 4.7% |
| Canadians | 84.4 /100 | #140 | Excellent 4.7% |
| Basques | 81.8 /100 | #141 | Excellent 4.6% |
| Sudanese | 81.3 /100 | #142 | Excellent 4.6% |
| Hungarians | 80.8 /100 | #143 | Excellent 4.6% |
| Immigrants | South America | 80.5 /100 | #144 | Excellent 4.6% |
| Uruguayans | 80.2 /100 | #145 | Excellent 4.6% |
| Luxembourgers | 78.7 /100 | #146 | Good 4.6% |
| Colombians | 77.7 /100 | #147 | Good 4.6% |
| Slovenes | 76.1 /100 | #148 | Good 4.6% |
| Senegalese | 75.3 /100 | #149 | Good 4.6% |