Scotch-Irish vs Sudanese High School Diploma
COMPARE
Scotch-Irish
Sudanese
High School Diploma
High School Diploma Comparison
Scotch-Irish
Sudanese
90.8%
HIGH SCHOOL DIPLOMA
99.2/ 100
METRIC RATING
82nd/ 347
METRIC RANK
89.1%
HIGH SCHOOL DIPLOMA
48.5/ 100
METRIC RATING
177th/ 347
METRIC RANK
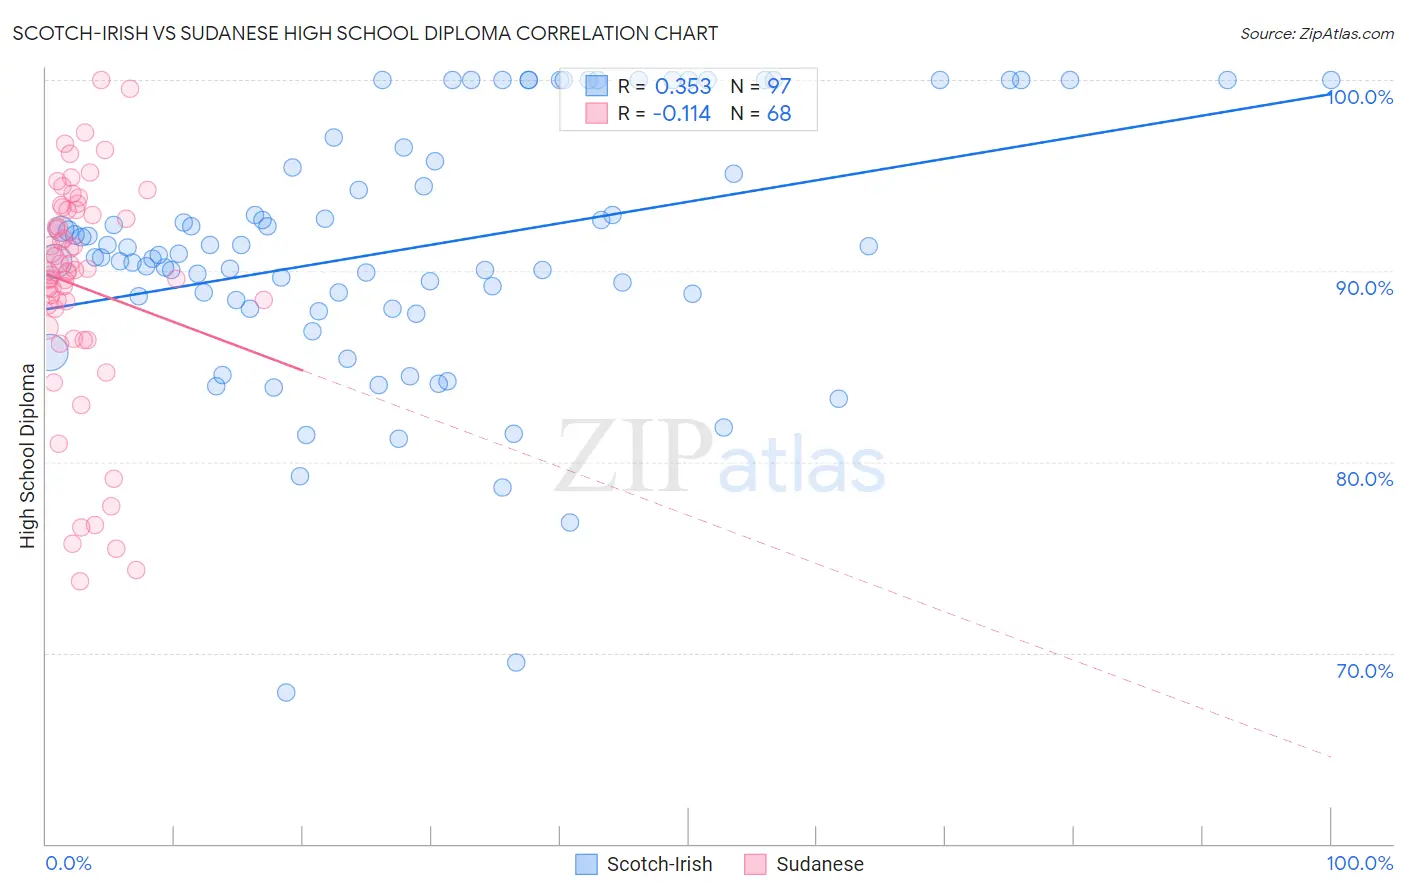
Scotch-Irish vs Sudanese High School Diploma Correlation Chart
The statistical analysis conducted on geographies consisting of 548,780,422 people shows a mild positive correlation between the proportion of Scotch-Irish and percentage of population with at least high school diploma education in the United States with a correlation coefficient (R) of 0.353 and weighted average of 90.8%. Similarly, the statistical analysis conducted on geographies consisting of 110,147,806 people shows a poor negative correlation between the proportion of Sudanese and percentage of population with at least high school diploma education in the United States with a correlation coefficient (R) of -0.114 and weighted average of 89.1%, a difference of 1.8%.
High School Diploma Correlation Summary
| Measurement | Scotch-Irish | Sudanese |
| Minimum | 67.9% | 73.7% |
| Maximum | 100.0% | 100.0% |
| Range | 32.1% | 26.3% |
| Mean | 91.2% | 89.2% |
| Median | 90.9% | 90.0% |
| Interquartile 25% (IQ1) | 88.2% | 87.5% |
| Interquartile 75% (IQ3) | 96.1% | 93.2% |
| Interquartile Range (IQR) | 7.9% | 5.7% |
| Standard Deviation (Sample) | 6.7% | 6.0% |
| Standard Deviation (Population) | 6.7% | 5.9% |
Similar Demographics by High School Diploma
Demographics Similar to Scotch-Irish by High School Diploma
In terms of high school diploma, the demographic groups most similar to Scotch-Irish are Immigrants from Moldova (90.7%, a difference of 0.020%), Immigrants from England (90.8%, a difference of 0.040%), Immigrants from Switzerland (90.8%, a difference of 0.040%), Immigrants from Denmark (90.8%, a difference of 0.050%), and Immigrants from Saudi Arabia (90.7%, a difference of 0.050%).
| Demographics | Rating | Rank | High School Diploma |
| Cambodians | 99.4 /100 | #75 | Exceptional 90.8% |
| Hungarians | 99.3 /100 | #76 | Exceptional 90.8% |
| Native Hawaiians | 99.3 /100 | #77 | Exceptional 90.8% |
| Burmese | 99.3 /100 | #78 | Exceptional 90.8% |
| Immigrants | Denmark | 99.3 /100 | #79 | Exceptional 90.8% |
| Immigrants | England | 99.3 /100 | #80 | Exceptional 90.8% |
| Immigrants | Switzerland | 99.3 /100 | #81 | Exceptional 90.8% |
| Scotch-Irish | 99.2 /100 | #82 | Exceptional 90.8% |
| Immigrants | Moldova | 99.2 /100 | #83 | Exceptional 90.7% |
| Immigrants | Saudi Arabia | 99.1 /100 | #84 | Exceptional 90.7% |
| Romanians | 98.9 /100 | #85 | Exceptional 90.7% |
| Immigrants | Bulgaria | 98.9 /100 | #86 | Exceptional 90.6% |
| Immigrants | Turkey | 98.9 /100 | #87 | Exceptional 90.6% |
| Immigrants | France | 98.8 /100 | #88 | Exceptional 90.6% |
| Canadians | 98.7 /100 | #89 | Exceptional 90.6% |
Demographics Similar to Sudanese by High School Diploma
In terms of high school diploma, the demographic groups most similar to Sudanese are Sierra Leonean (89.1%, a difference of 0.0%), Immigrants from Western Asia (89.1%, a difference of 0.010%), Osage (89.1%, a difference of 0.010%), Hmong (89.1%, a difference of 0.020%), and American (89.1%, a difference of 0.020%).
| Demographics | Rating | Rank | High School Diploma |
| Immigrants | Morocco | 53.3 /100 | #170 | Average 89.2% |
| Spanish | 52.9 /100 | #171 | Average 89.2% |
| Immigrants | Nonimmigrants | 51.8 /100 | #172 | Average 89.2% |
| Immigrants | Indonesia | 50.3 /100 | #173 | Average 89.1% |
| Hmong | 50.0 /100 | #174 | Average 89.1% |
| Immigrants | Western Asia | 49.0 /100 | #175 | Average 89.1% |
| Osage | 48.9 /100 | #176 | Average 89.1% |
| Sudanese | 48.5 /100 | #177 | Average 89.1% |
| Sierra Leoneans | 48.4 /100 | #178 | Average 89.1% |
| Americans | 47.2 /100 | #179 | Average 89.1% |
| Bolivians | 45.2 /100 | #180 | Average 89.1% |
| Venezuelans | 43.6 /100 | #181 | Average 89.1% |
| Spaniards | 43.4 /100 | #182 | Average 89.1% |
| Potawatomi | 42.5 /100 | #183 | Average 89.0% |
| Immigrants | Syria | 39.2 /100 | #184 | Fair 89.0% |