Scotch-Irish vs Sudanese Male Poverty
COMPARE
Scotch-Irish
Sudanese
Male Poverty
Male Poverty Comparison
Scotch-Irish
Sudanese
11.0%
MALE POVERTY
63.7/ 100
METRIC RATING
157th/ 347
METRIC RANK
12.8%
MALE POVERTY
0.3/ 100
METRIC RATING
241st/ 347
METRIC RANK
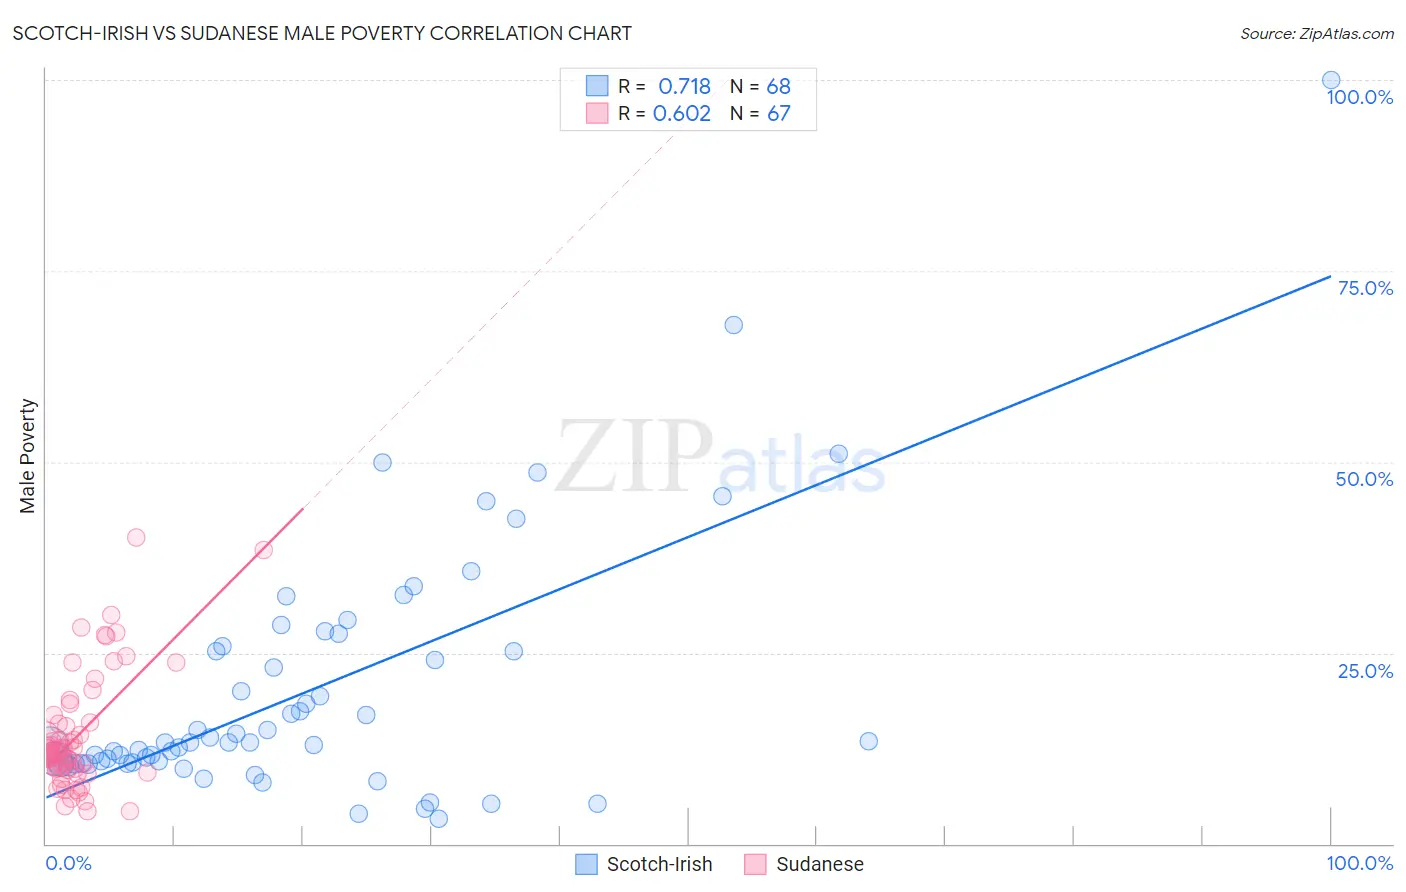
Scotch-Irish vs Sudanese Male Poverty Correlation Chart
The statistical analysis conducted on geographies consisting of 547,595,685 people shows a strong positive correlation between the proportion of Scotch-Irish and poverty level among males in the United States with a correlation coefficient (R) of 0.718 and weighted average of 11.0%. Similarly, the statistical analysis conducted on geographies consisting of 110,106,340 people shows a significant positive correlation between the proportion of Sudanese and poverty level among males in the United States with a correlation coefficient (R) of 0.602 and weighted average of 12.8%, a difference of 15.7%.
Male Poverty Correlation Summary
| Measurement | Scotch-Irish | Sudanese |
| Minimum | 3.2% | 4.2% |
| Maximum | 100.0% | 40.1% |
| Range | 96.8% | 35.9% |
| Mean | 20.1% | 14.2% |
| Median | 13.3% | 12.0% |
| Interquartile 25% (IQ1) | 10.6% | 9.8% |
| Interquartile 75% (IQ3) | 25.5% | 15.8% |
| Interquartile Range (IQR) | 14.9% | 6.1% |
| Standard Deviation (Sample) | 16.5% | 7.6% |
| Standard Deviation (Population) | 16.4% | 7.6% |
Similar Demographics by Male Poverty
Demographics Similar to Scotch-Irish by Male Poverty
In terms of male poverty, the demographic groups most similar to Scotch-Irish are Costa Rican (11.0%, a difference of 0.020%), Colombian (11.0%, a difference of 0.080%), Taiwanese (11.0%, a difference of 0.10%), Immigrants from Malaysia (11.0%, a difference of 0.11%), and Immigrants from Kazakhstan (11.0%, a difference of 0.12%).
| Demographics | Rating | Rank | Male Poverty |
| Guamanians/Chamorros | 67.6 /100 | #150 | Good 11.0% |
| Venezuelans | 67.4 /100 | #151 | Good 11.0% |
| Immigrants | Nepal | 67.3 /100 | #152 | Good 11.0% |
| Immigrants | Bosnia and Herzegovina | 65.2 /100 | #153 | Good 11.0% |
| Immigrants | Kazakhstan | 64.8 /100 | #154 | Good 11.0% |
| Immigrants | Malaysia | 64.7 /100 | #155 | Good 11.0% |
| Costa Ricans | 63.9 /100 | #156 | Good 11.0% |
| Scotch-Irish | 63.7 /100 | #157 | Good 11.0% |
| Colombians | 63.0 /100 | #158 | Good 11.0% |
| Taiwanese | 62.7 /100 | #159 | Good 11.0% |
| Soviet Union | 60.3 /100 | #160 | Good 11.1% |
| Immigrants | Northern Africa | 59.7 /100 | #161 | Average 11.1% |
| Immigrants | Chile | 57.4 /100 | #162 | Average 11.1% |
| Whites/Caucasians | 56.7 /100 | #163 | Average 11.1% |
| Ethiopians | 56.7 /100 | #164 | Average 11.1% |
Demographics Similar to Sudanese by Male Poverty
In terms of male poverty, the demographic groups most similar to Sudanese are Nepalese (12.8%, a difference of 0.17%), Alaskan Athabascan (12.8%, a difference of 0.20%), Tsimshian (12.8%, a difference of 0.31%), Liberian (12.8%, a difference of 0.32%), and Immigrants from Middle Africa (12.7%, a difference of 0.36%).
| Demographics | Rating | Rank | Male Poverty |
| Immigrants | Armenia | 0.6 /100 | #234 | Tragic 12.6% |
| Immigrants | Laos | 0.5 /100 | #235 | Tragic 12.6% |
| Immigrants | Saudi Arabia | 0.4 /100 | #236 | Tragic 12.7% |
| French American Indians | 0.4 /100 | #237 | Tragic 12.7% |
| Ecuadorians | 0.4 /100 | #238 | Tragic 12.7% |
| Ghanaians | 0.4 /100 | #239 | Tragic 12.7% |
| Immigrants | Middle Africa | 0.4 /100 | #240 | Tragic 12.7% |
| Sudanese | 0.3 /100 | #241 | Tragic 12.8% |
| Nepalese | 0.3 /100 | #242 | Tragic 12.8% |
| Alaskan Athabascans | 0.3 /100 | #243 | Tragic 12.8% |
| Tsimshian | 0.3 /100 | #244 | Tragic 12.8% |
| Liberians | 0.3 /100 | #245 | Tragic 12.8% |
| Immigrants | El Salvador | 0.2 /100 | #246 | Tragic 12.8% |
| Immigrants | Western Africa | 0.2 /100 | #247 | Tragic 12.9% |
| Immigrants | Sudan | 0.2 /100 | #248 | Tragic 12.9% |