Scotch-Irish vs Alaskan Athabascan Disability Age 18 to 34
COMPARE
Scotch-Irish
Alaskan Athabascan
Disability Age 18 to 34
Disability Age 18 to 34 Comparison
Scotch-Irish
Alaskan Athabascans
7.8%
DISABILITY AGE 18 TO 34
0.0/ 100
METRIC RATING
307th/ 347
METRIC RANK
9.4%
DISABILITY AGE 18 TO 34
0.0/ 100
METRIC RATING
345th/ 347
METRIC RANK
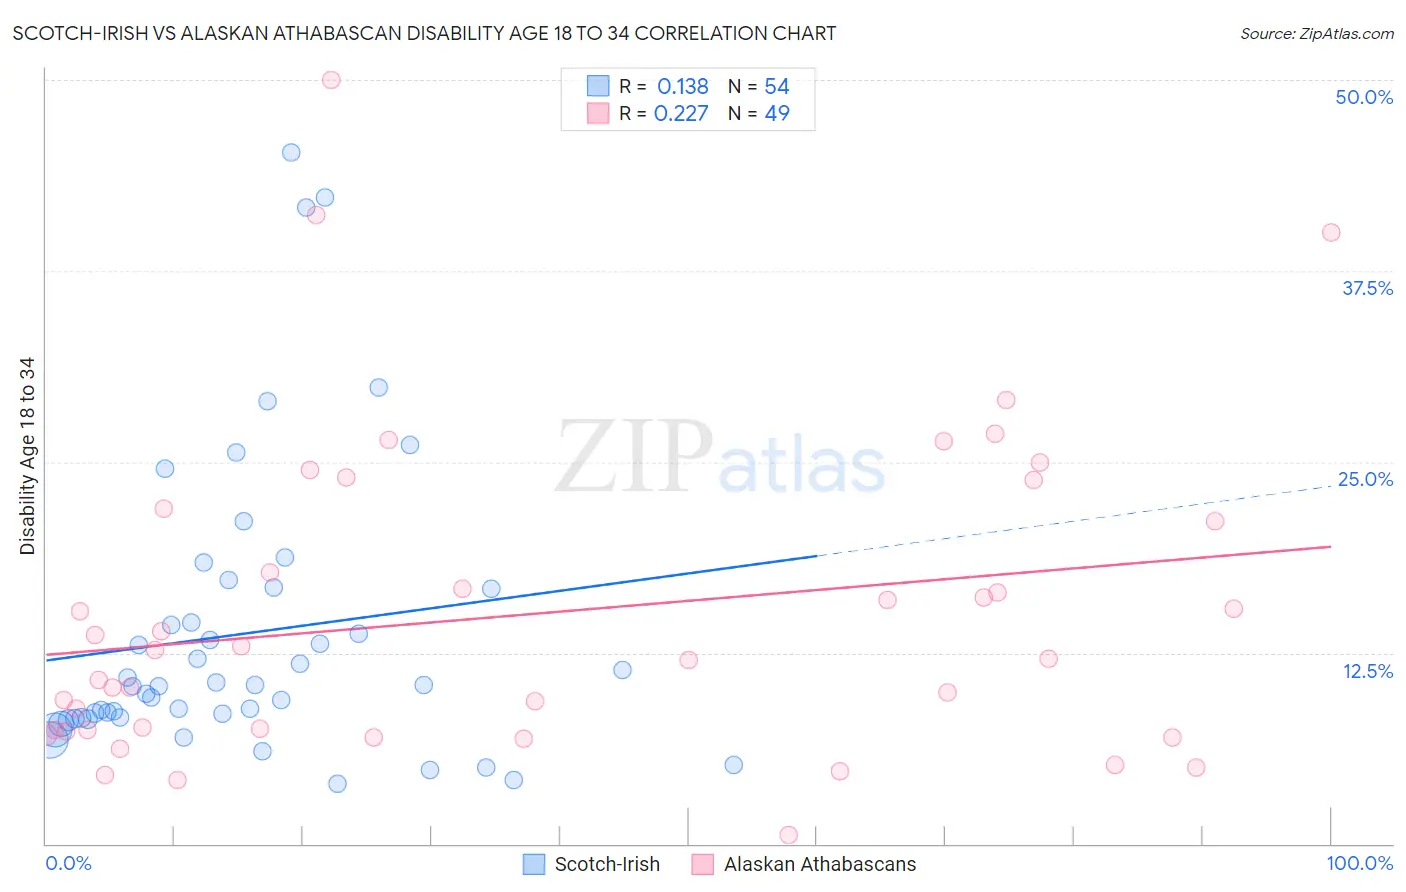
Scotch-Irish vs Alaskan Athabascan Disability Age 18 to 34 Correlation Chart
The statistical analysis conducted on geographies consisting of 544,079,261 people shows a poor positive correlation between the proportion of Scotch-Irish and percentage of population with a disability between the ages 18 and 35 in the United States with a correlation coefficient (R) of 0.138 and weighted average of 7.8%. Similarly, the statistical analysis conducted on geographies consisting of 45,771,515 people shows a weak positive correlation between the proportion of Alaskan Athabascans and percentage of population with a disability between the ages 18 and 35 in the United States with a correlation coefficient (R) of 0.227 and weighted average of 9.4%, a difference of 21.0%.
Disability Age 18 to 34 Correlation Summary
| Measurement | Scotch-Irish | Alaskan Athabascan |
| Minimum | 3.9% | 0.60% |
| Maximum | 45.2% | 50.0% |
| Range | 41.3% | 49.4% |
| Mean | 13.7% | 15.0% |
| Median | 10.4% | 12.1% |
| Interquartile 25% (IQ1) | 8.2% | 7.4% |
| Interquartile 75% (IQ3) | 16.7% | 21.5% |
| Interquartile Range (IQR) | 8.4% | 14.1% |
| Standard Deviation (Sample) | 9.4% | 10.4% |
| Standard Deviation (Population) | 9.4% | 10.3% |
Similar Demographics by Disability Age 18 to 34
Demographics Similar to Scotch-Irish by Disability Age 18 to 34
In terms of disability age 18 to 34, the demographic groups most similar to Scotch-Irish are Pennsylvania German (7.8%, a difference of 0.030%), Alaska Native (7.8%, a difference of 0.040%), Finnish (7.8%, a difference of 0.10%), English (7.8%, a difference of 0.26%), and Menominee (7.8%, a difference of 0.34%).
| Demographics | Rating | Rank | Disability Age 18 to 34 |
| Scottish | 0.0 /100 | #300 | Tragic 7.7% |
| Pima | 0.0 /100 | #301 | Tragic 7.7% |
| Welsh | 0.0 /100 | #302 | Tragic 7.7% |
| Cheyenne | 0.0 /100 | #303 | Tragic 7.7% |
| Shoshone | 0.0 /100 | #304 | Tragic 7.8% |
| Menominee | 0.0 /100 | #305 | Tragic 7.8% |
| English | 0.0 /100 | #306 | Tragic 7.8% |
| Scotch-Irish | 0.0 /100 | #307 | Tragic 7.8% |
| Pennsylvania Germans | 0.0 /100 | #308 | Tragic 7.8% |
| Alaska Natives | 0.0 /100 | #309 | Tragic 7.8% |
| Finns | 0.0 /100 | #310 | Tragic 7.8% |
| French | 0.0 /100 | #311 | Tragic 7.9% |
| Spanish Americans | 0.0 /100 | #312 | Tragic 7.9% |
| Iroquois | 0.0 /100 | #313 | Tragic 7.9% |
| Colville | 0.0 /100 | #314 | Tragic 7.9% |
Demographics Similar to Alaskan Athabascans by Disability Age 18 to 34
In terms of disability age 18 to 34, the demographic groups most similar to Alaskan Athabascans are Houma (9.7%, a difference of 2.7%), Creek (9.0%, a difference of 4.8%), Chippewa (9.0%, a difference of 5.2%), Yakama (9.0%, a difference of 5.2%), and Chickasaw (9.0%, a difference of 5.2%).
| Demographics | Rating | Rank | Disability Age 18 to 34 |
| Apache | 0.0 /100 | #333 | Tragic 8.4% |
| Dutch West Indians | 0.0 /100 | #334 | Tragic 8.4% |
| Seminole | 0.0 /100 | #335 | Tragic 8.4% |
| Immigrants | Azores | 0.0 /100 | #336 | Tragic 8.5% |
| Ottawa | 0.0 /100 | #337 | Tragic 8.6% |
| Cherokee | 0.0 /100 | #338 | Tragic 8.7% |
| Kiowa | 0.0 /100 | #339 | Tragic 8.8% |
| Choctaw | 0.0 /100 | #340 | Tragic 9.0% |
| Chickasaw | 0.0 /100 | #341 | Tragic 9.0% |
| Yakama | 0.0 /100 | #342 | Tragic 9.0% |
| Chippewa | 0.0 /100 | #343 | Tragic 9.0% |
| Creek | 0.0 /100 | #344 | Tragic 9.0% |
| Alaskan Athabascans | 0.0 /100 | #345 | Tragic 9.4% |
| Houma | 0.0 /100 | #346 | Tragic 9.7% |
| Yuman | 0.0 /100 | #347 | Tragic 10.6% |