Scotch-Irish vs Paraguayan Disability Age 18 to 34
COMPARE
Scotch-Irish
Paraguayan
Disability Age 18 to 34
Disability Age 18 to 34 Comparison
Scotch-Irish
Paraguayans
7.8%
DISABILITY AGE 18 TO 34
0.0/ 100
METRIC RATING
307th/ 347
METRIC RANK
5.9%
DISABILITY AGE 18 TO 34
99.7/ 100
METRIC RATING
56th/ 347
METRIC RANK
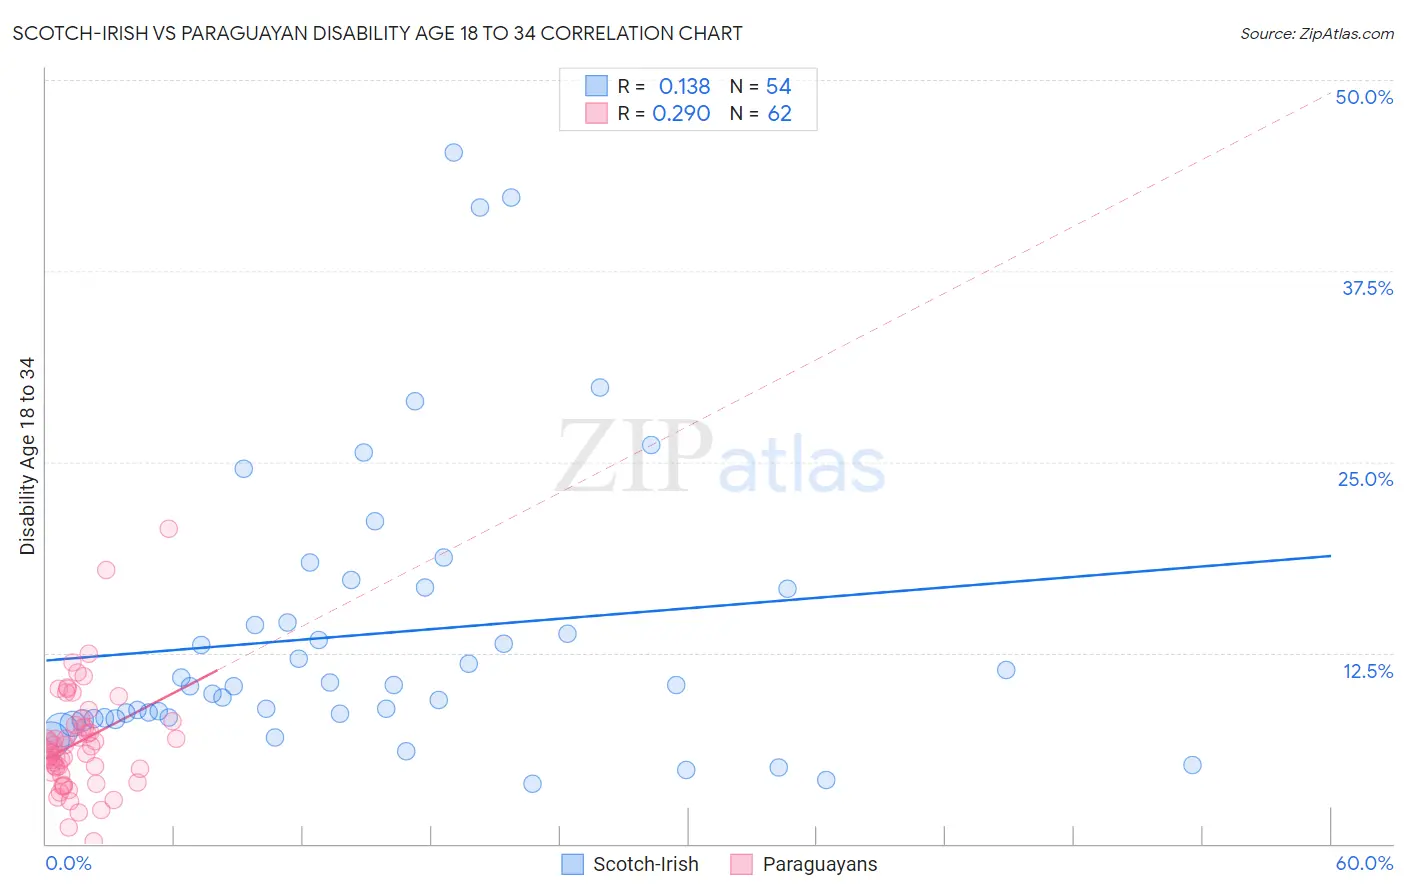
Scotch-Irish vs Paraguayan Disability Age 18 to 34 Correlation Chart
The statistical analysis conducted on geographies consisting of 544,079,261 people shows a poor positive correlation between the proportion of Scotch-Irish and percentage of population with a disability between the ages 18 and 35 in the United States with a correlation coefficient (R) of 0.138 and weighted average of 7.8%. Similarly, the statistical analysis conducted on geographies consisting of 95,068,899 people shows a weak positive correlation between the proportion of Paraguayans and percentage of population with a disability between the ages 18 and 35 in the United States with a correlation coefficient (R) of 0.290 and weighted average of 5.9%, a difference of 31.4%.
Disability Age 18 to 34 Correlation Summary
| Measurement | Scotch-Irish | Paraguayan |
| Minimum | 3.9% | 0.13% |
| Maximum | 45.2% | 20.6% |
| Range | 41.3% | 20.5% |
| Mean | 13.7% | 6.6% |
| Median | 10.4% | 6.0% |
| Interquartile 25% (IQ1) | 8.2% | 4.6% |
| Interquartile 75% (IQ3) | 16.7% | 7.8% |
| Interquartile Range (IQR) | 8.4% | 3.1% |
| Standard Deviation (Sample) | 9.4% | 3.5% |
| Standard Deviation (Population) | 9.4% | 3.5% |
Similar Demographics by Disability Age 18 to 34
Demographics Similar to Scotch-Irish by Disability Age 18 to 34
In terms of disability age 18 to 34, the demographic groups most similar to Scotch-Irish are Pennsylvania German (7.8%, a difference of 0.030%), Alaska Native (7.8%, a difference of 0.040%), Finnish (7.8%, a difference of 0.10%), English (7.8%, a difference of 0.26%), and Menominee (7.8%, a difference of 0.34%).
| Demographics | Rating | Rank | Disability Age 18 to 34 |
| Scottish | 0.0 /100 | #300 | Tragic 7.7% |
| Pima | 0.0 /100 | #301 | Tragic 7.7% |
| Welsh | 0.0 /100 | #302 | Tragic 7.7% |
| Cheyenne | 0.0 /100 | #303 | Tragic 7.7% |
| Shoshone | 0.0 /100 | #304 | Tragic 7.8% |
| Menominee | 0.0 /100 | #305 | Tragic 7.8% |
| English | 0.0 /100 | #306 | Tragic 7.8% |
| Scotch-Irish | 0.0 /100 | #307 | Tragic 7.8% |
| Pennsylvania Germans | 0.0 /100 | #308 | Tragic 7.8% |
| Alaska Natives | 0.0 /100 | #309 | Tragic 7.8% |
| Finns | 0.0 /100 | #310 | Tragic 7.8% |
| French | 0.0 /100 | #311 | Tragic 7.9% |
| Spanish Americans | 0.0 /100 | #312 | Tragic 7.9% |
| Iroquois | 0.0 /100 | #313 | Tragic 7.9% |
| Colville | 0.0 /100 | #314 | Tragic 7.9% |
Demographics Similar to Paraguayans by Disability Age 18 to 34
In terms of disability age 18 to 34, the demographic groups most similar to Paraguayans are Immigrants from Haiti (5.9%, a difference of 0.11%), Immigrants from Serbia (5.9%, a difference of 0.13%), Immigrants from Spain (5.9%, a difference of 0.16%), Immigrants from Malaysia (5.9%, a difference of 0.17%), and Immigrants from Indonesia (5.9%, a difference of 0.22%).
| Demographics | Rating | Rank | Disability Age 18 to 34 |
| Immigrants | Belarus | 99.8 /100 | #49 | Exceptional 5.9% |
| Immigrants | El Salvador | 99.8 /100 | #50 | Exceptional 5.9% |
| Egyptians | 99.8 /100 | #51 | Exceptional 5.9% |
| Okinawans | 99.7 /100 | #52 | Exceptional 5.9% |
| Immigrants | Indonesia | 99.7 /100 | #53 | Exceptional 5.9% |
| Immigrants | Malaysia | 99.7 /100 | #54 | Exceptional 5.9% |
| Immigrants | Spain | 99.7 /100 | #55 | Exceptional 5.9% |
| Paraguayans | 99.7 /100 | #56 | Exceptional 5.9% |
| Immigrants | Haiti | 99.7 /100 | #57 | Exceptional 5.9% |
| Immigrants | Serbia | 99.7 /100 | #58 | Exceptional 5.9% |
| Immigrants | Caribbean | 99.6 /100 | #59 | Exceptional 6.0% |
| Immigrants | Sri Lanka | 99.6 /100 | #60 | Exceptional 6.0% |
| British West Indians | 99.6 /100 | #61 | Exceptional 6.0% |
| Peruvians | 99.6 /100 | #62 | Exceptional 6.0% |
| Salvadorans | 99.6 /100 | #63 | Exceptional 6.0% |