Scotch-Irish vs Uruguayan Disability Age 18 to 34
COMPARE
Scotch-Irish
Uruguayan
Disability Age 18 to 34
Disability Age 18 to 34 Comparison
Scotch-Irish
Uruguayans
7.8%
DISABILITY AGE 18 TO 34
0.0/ 100
METRIC RATING
307th/ 347
METRIC RANK
6.2%
DISABILITY AGE 18 TO 34
97.3/ 100
METRIC RATING
97th/ 347
METRIC RANK
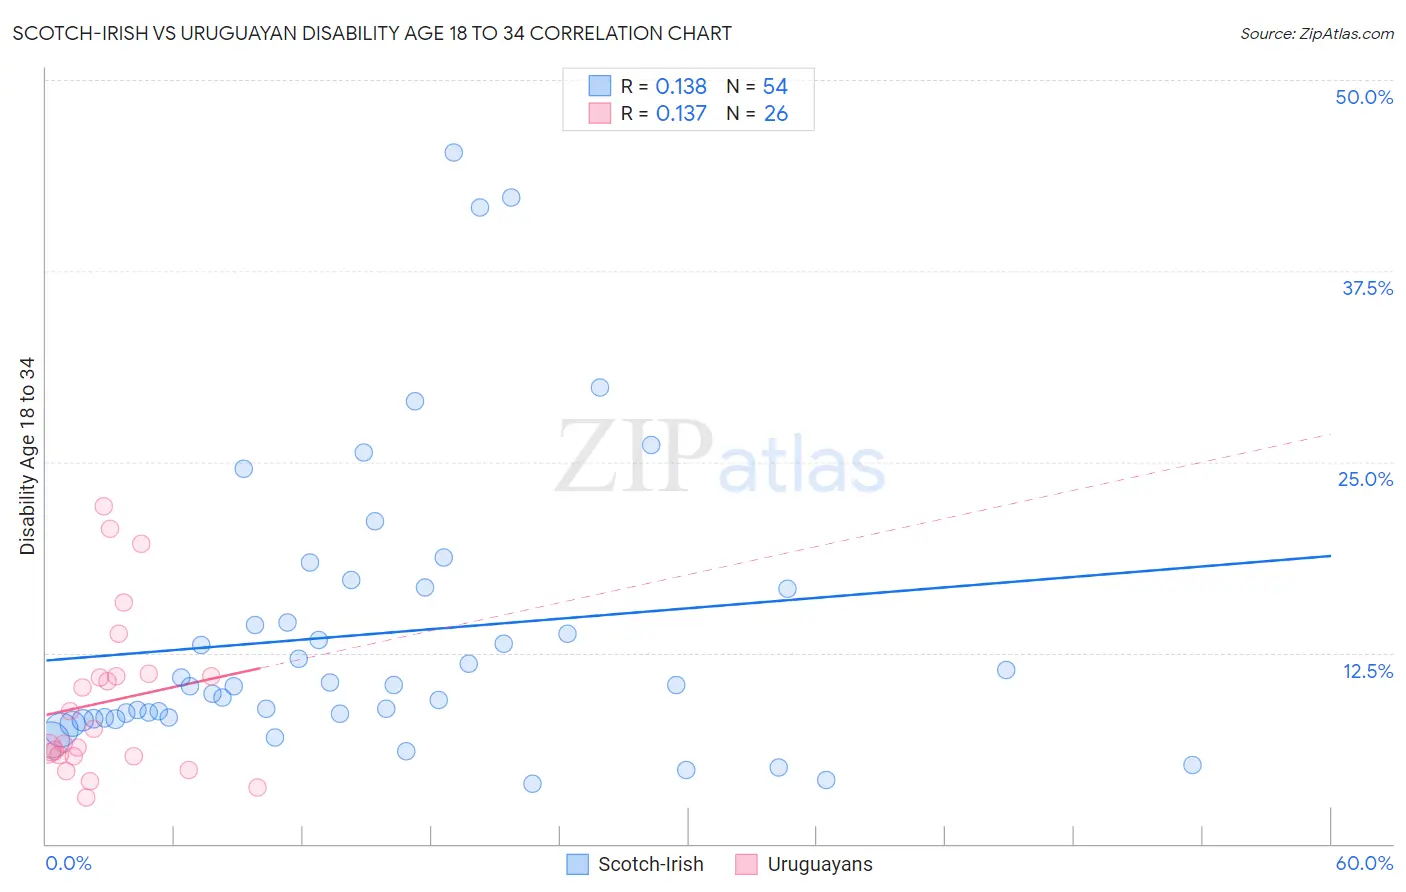
Scotch-Irish vs Uruguayan Disability Age 18 to 34 Correlation Chart
The statistical analysis conducted on geographies consisting of 544,079,261 people shows a poor positive correlation between the proportion of Scotch-Irish and percentage of population with a disability between the ages 18 and 35 in the United States with a correlation coefficient (R) of 0.138 and weighted average of 7.8%. Similarly, the statistical analysis conducted on geographies consisting of 144,733,495 people shows a poor positive correlation between the proportion of Uruguayans and percentage of population with a disability between the ages 18 and 35 in the United States with a correlation coefficient (R) of 0.137 and weighted average of 6.2%, a difference of 26.1%.
Disability Age 18 to 34 Correlation Summary
| Measurement | Scotch-Irish | Uruguayan |
| Minimum | 3.9% | 3.0% |
| Maximum | 45.2% | 22.1% |
| Range | 41.3% | 19.0% |
| Mean | 13.7% | 9.3% |
| Median | 10.4% | 7.0% |
| Interquartile 25% (IQ1) | 8.2% | 5.8% |
| Interquartile 75% (IQ3) | 16.7% | 11.0% |
| Interquartile Range (IQR) | 8.4% | 5.2% |
| Standard Deviation (Sample) | 9.4% | 5.3% |
| Standard Deviation (Population) | 9.4% | 5.2% |
Similar Demographics by Disability Age 18 to 34
Demographics Similar to Scotch-Irish by Disability Age 18 to 34
In terms of disability age 18 to 34, the demographic groups most similar to Scotch-Irish are Pennsylvania German (7.8%, a difference of 0.030%), Alaska Native (7.8%, a difference of 0.040%), Finnish (7.8%, a difference of 0.10%), English (7.8%, a difference of 0.26%), and Menominee (7.8%, a difference of 0.34%).
| Demographics | Rating | Rank | Disability Age 18 to 34 |
| Scottish | 0.0 /100 | #300 | Tragic 7.7% |
| Pima | 0.0 /100 | #301 | Tragic 7.7% |
| Welsh | 0.0 /100 | #302 | Tragic 7.7% |
| Cheyenne | 0.0 /100 | #303 | Tragic 7.7% |
| Shoshone | 0.0 /100 | #304 | Tragic 7.8% |
| Menominee | 0.0 /100 | #305 | Tragic 7.8% |
| English | 0.0 /100 | #306 | Tragic 7.8% |
| Scotch-Irish | 0.0 /100 | #307 | Tragic 7.8% |
| Pennsylvania Germans | 0.0 /100 | #308 | Tragic 7.8% |
| Alaska Natives | 0.0 /100 | #309 | Tragic 7.8% |
| Finns | 0.0 /100 | #310 | Tragic 7.8% |
| French | 0.0 /100 | #311 | Tragic 7.9% |
| Spanish Americans | 0.0 /100 | #312 | Tragic 7.9% |
| Iroquois | 0.0 /100 | #313 | Tragic 7.9% |
| Colville | 0.0 /100 | #314 | Tragic 7.9% |
Demographics Similar to Uruguayans by Disability Age 18 to 34
In terms of disability age 18 to 34, the demographic groups most similar to Uruguayans are Immigrants from Syria (6.2%, a difference of 0.040%), Immigrants from Uruguay (6.2%, a difference of 0.080%), Central American (6.2%, a difference of 0.13%), Immigrants from Kazakhstan (6.2%, a difference of 0.16%), and Immigrants (6.2%, a difference of 0.21%).
| Demographics | Rating | Rank | Disability Age 18 to 34 |
| Immigrants | Vietnam | 97.7 /100 | #90 | Exceptional 6.2% |
| Immigrants | Philippines | 97.6 /100 | #91 | Exceptional 6.2% |
| Jordanians | 97.6 /100 | #92 | Exceptional 6.2% |
| Immigrants | Immigrants | 97.6 /100 | #93 | Exceptional 6.2% |
| Immigrants | Kazakhstan | 97.5 /100 | #94 | Exceptional 6.2% |
| Central Americans | 97.5 /100 | #95 | Exceptional 6.2% |
| Immigrants | Uruguay | 97.4 /100 | #96 | Exceptional 6.2% |
| Uruguayans | 97.3 /100 | #97 | Exceptional 6.2% |
| Immigrants | Syria | 97.2 /100 | #98 | Exceptional 6.2% |
| Immigrants | Ethiopia | 96.9 /100 | #99 | Exceptional 6.2% |
| Immigrants | Albania | 96.7 /100 | #100 | Exceptional 6.2% |
| Immigrants | Jamaica | 96.4 /100 | #101 | Exceptional 6.2% |
| Laotians | 96.4 /100 | #102 | Exceptional 6.2% |
| Immigrants | Bulgaria | 96.3 /100 | #103 | Exceptional 6.2% |
| Mongolians | 96.2 /100 | #104 | Exceptional 6.2% |