Scotch-Irish vs Nicaraguan Disability Age 18 to 34
COMPARE
Scotch-Irish
Nicaraguan
Disability Age 18 to 34
Disability Age 18 to 34 Comparison
Scotch-Irish
Nicaraguans
7.8%
DISABILITY AGE 18 TO 34
0.0/ 100
METRIC RATING
307th/ 347
METRIC RANK
5.8%
DISABILITY AGE 18 TO 34
99.9/ 100
METRIC RATING
41st/ 347
METRIC RANK
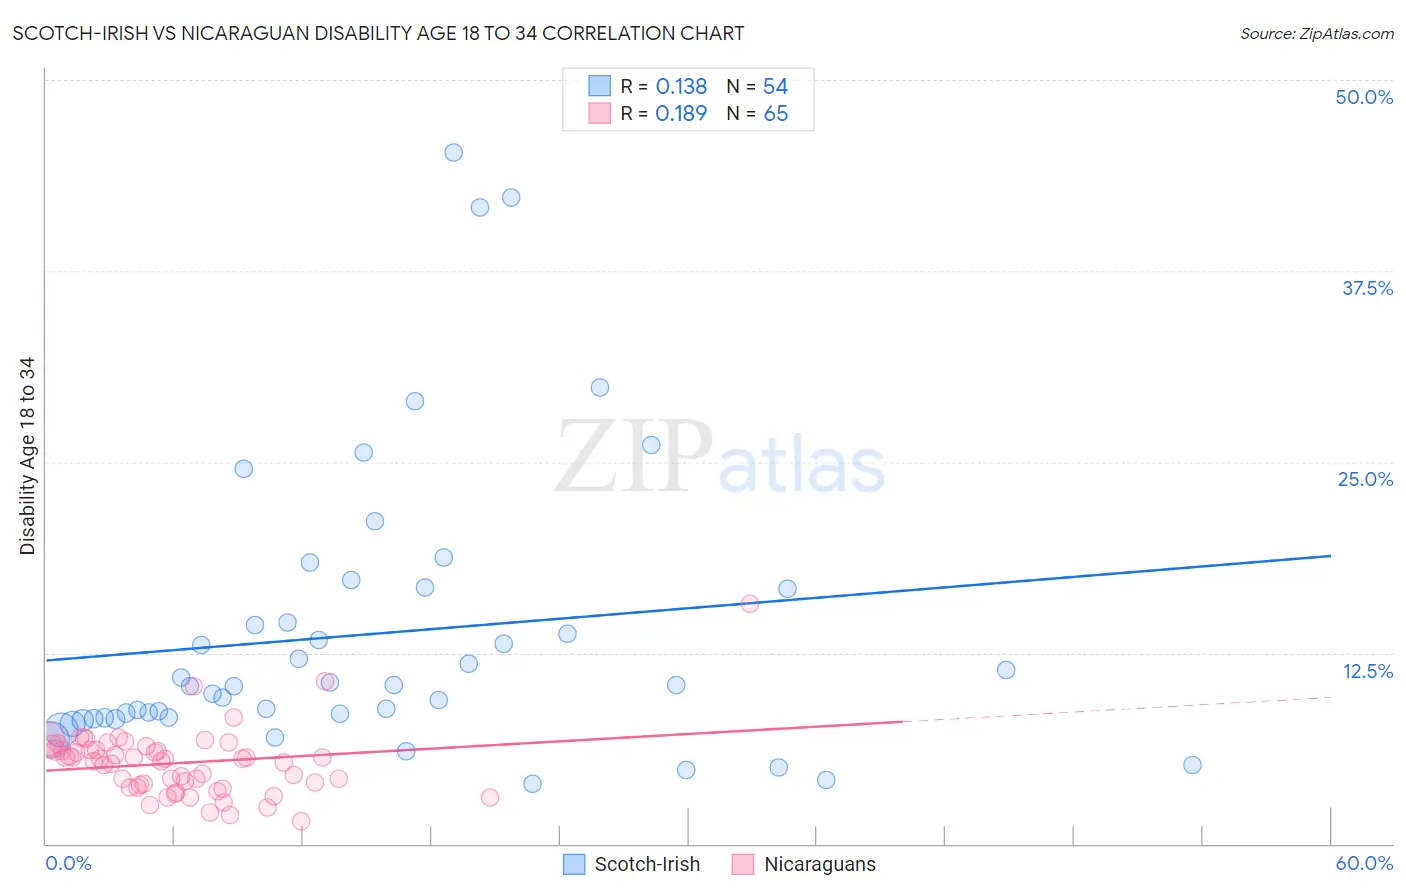
Scotch-Irish vs Nicaraguan Disability Age 18 to 34 Correlation Chart
The statistical analysis conducted on geographies consisting of 544,079,261 people shows a poor positive correlation between the proportion of Scotch-Irish and percentage of population with a disability between the ages 18 and 35 in the United States with a correlation coefficient (R) of 0.138 and weighted average of 7.8%. Similarly, the statistical analysis conducted on geographies consisting of 285,455,320 people shows a poor positive correlation between the proportion of Nicaraguans and percentage of population with a disability between the ages 18 and 35 in the United States with a correlation coefficient (R) of 0.189 and weighted average of 5.8%, a difference of 33.6%.
Disability Age 18 to 34 Correlation Summary
| Measurement | Scotch-Irish | Nicaraguan |
| Minimum | 3.9% | 1.5% |
| Maximum | 45.2% | 15.7% |
| Range | 41.3% | 14.3% |
| Mean | 13.7% | 5.3% |
| Median | 10.4% | 5.6% |
| Interquartile 25% (IQ1) | 8.2% | 3.8% |
| Interquartile 75% (IQ3) | 16.7% | 6.3% |
| Interquartile Range (IQR) | 8.4% | 2.5% |
| Standard Deviation (Sample) | 9.4% | 2.2% |
| Standard Deviation (Population) | 9.4% | 2.2% |
Similar Demographics by Disability Age 18 to 34
Demographics Similar to Scotch-Irish by Disability Age 18 to 34
In terms of disability age 18 to 34, the demographic groups most similar to Scotch-Irish are Pennsylvania German (7.8%, a difference of 0.030%), Alaska Native (7.8%, a difference of 0.040%), Finnish (7.8%, a difference of 0.10%), English (7.8%, a difference of 0.26%), and Menominee (7.8%, a difference of 0.34%).
| Demographics | Rating | Rank | Disability Age 18 to 34 |
| Scottish | 0.0 /100 | #300 | Tragic 7.7% |
| Pima | 0.0 /100 | #301 | Tragic 7.7% |
| Welsh | 0.0 /100 | #302 | Tragic 7.7% |
| Cheyenne | 0.0 /100 | #303 | Tragic 7.7% |
| Shoshone | 0.0 /100 | #304 | Tragic 7.8% |
| Menominee | 0.0 /100 | #305 | Tragic 7.8% |
| English | 0.0 /100 | #306 | Tragic 7.8% |
| Scotch-Irish | 0.0 /100 | #307 | Tragic 7.8% |
| Pennsylvania Germans | 0.0 /100 | #308 | Tragic 7.8% |
| Alaska Natives | 0.0 /100 | #309 | Tragic 7.8% |
| Finns | 0.0 /100 | #310 | Tragic 7.8% |
| French | 0.0 /100 | #311 | Tragic 7.9% |
| Spanish Americans | 0.0 /100 | #312 | Tragic 7.9% |
| Iroquois | 0.0 /100 | #313 | Tragic 7.9% |
| Colville | 0.0 /100 | #314 | Tragic 7.9% |
Demographics Similar to Nicaraguans by Disability Age 18 to 34
In terms of disability age 18 to 34, the demographic groups most similar to Nicaraguans are Bolivian (5.8%, a difference of 0.18%), Colombian (5.9%, a difference of 0.22%), South American (5.9%, a difference of 0.23%), Immigrants from Asia (5.9%, a difference of 0.25%), and Asian (5.8%, a difference of 0.26%).
| Demographics | Rating | Rank | Disability Age 18 to 34 |
| Venezuelans | 99.9 /100 | #34 | Exceptional 5.8% |
| Immigrants | Lithuania | 99.9 /100 | #35 | Exceptional 5.8% |
| Ecuadorians | 99.9 /100 | #36 | Exceptional 5.8% |
| Armenians | 99.9 /100 | #37 | Exceptional 5.8% |
| Immigrants | South America | 99.9 /100 | #38 | Exceptional 5.8% |
| Asians | 99.9 /100 | #39 | Exceptional 5.8% |
| Bolivians | 99.9 /100 | #40 | Exceptional 5.8% |
| Nicaraguans | 99.9 /100 | #41 | Exceptional 5.8% |
| Colombians | 99.8 /100 | #42 | Exceptional 5.9% |
| South Americans | 99.8 /100 | #43 | Exceptional 5.9% |
| Immigrants | Asia | 99.8 /100 | #44 | Exceptional 5.9% |
| Immigrants | Peru | 99.8 /100 | #45 | Exceptional 5.9% |
| Immigrants | Korea | 99.8 /100 | #46 | Exceptional 5.9% |
| Immigrants | Egypt | 99.8 /100 | #47 | Exceptional 5.9% |
| Immigrants | Trinidad and Tobago | 99.8 /100 | #48 | Exceptional 5.9% |