Colombian vs Sudanese Disability Age 18 to 34
COMPARE
Colombian
Sudanese
Disability Age 18 to 34
Disability Age 18 to 34 Comparison
Colombians
Sudanese
5.9%
DISABILITY AGE 18 TO 34
99.8/ 100
METRIC RATING
42nd/ 347
METRIC RANK
6.9%
DISABILITY AGE 18 TO 34
7.0/ 100
METRIC RATING
216th/ 347
METRIC RANK
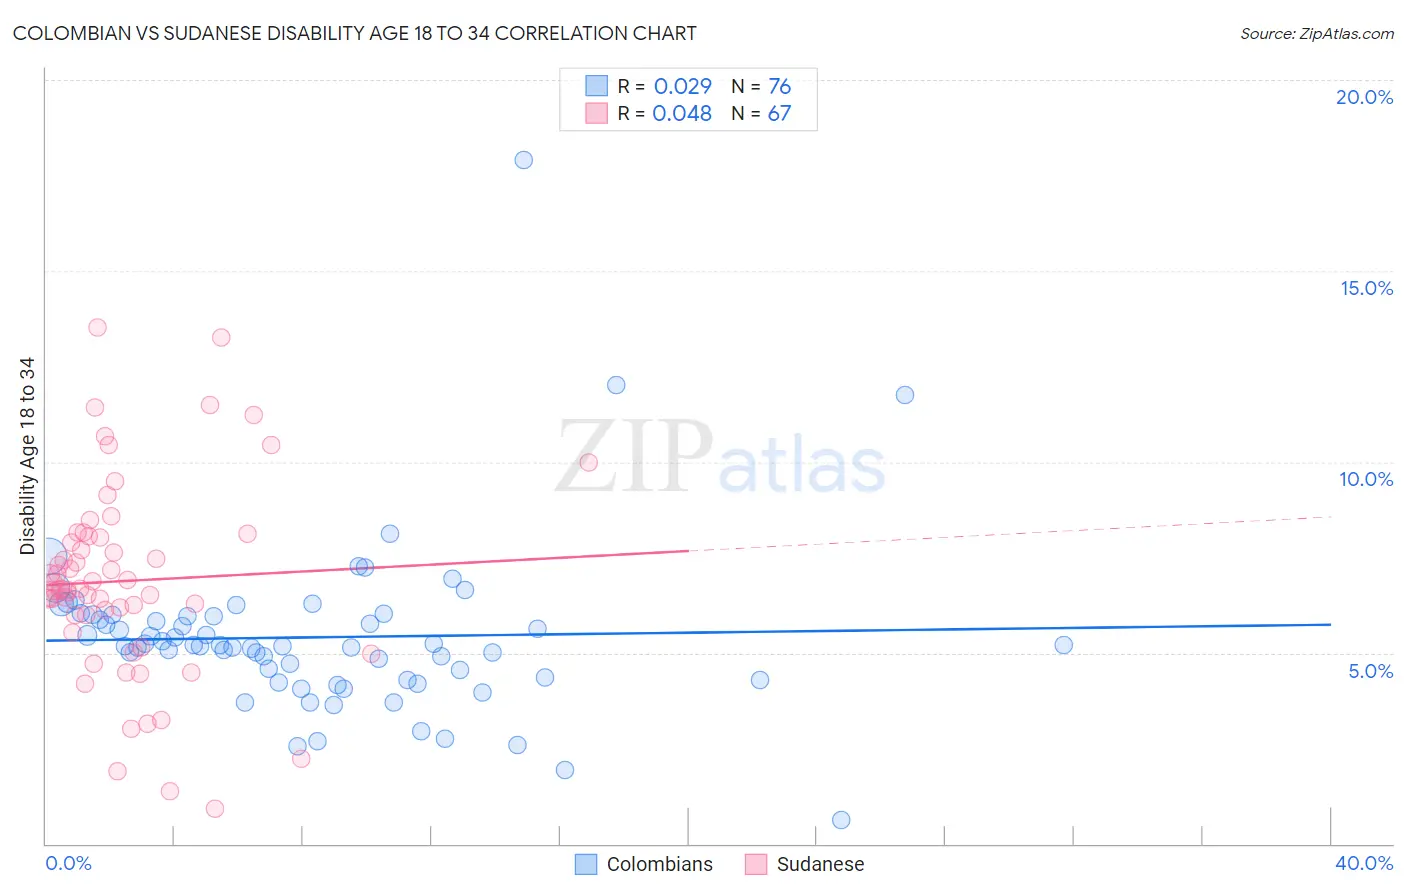
Colombian vs Sudanese Disability Age 18 to 34 Correlation Chart
The statistical analysis conducted on geographies consisting of 418,761,238 people shows no correlation between the proportion of Colombians and percentage of population with a disability between the ages 18 and 35 in the United States with a correlation coefficient (R) of 0.029 and weighted average of 5.9%. Similarly, the statistical analysis conducted on geographies consisting of 110,108,179 people shows no correlation between the proportion of Sudanese and percentage of population with a disability between the ages 18 and 35 in the United States with a correlation coefficient (R) of 0.048 and weighted average of 6.9%, a difference of 17.7%.
Disability Age 18 to 34 Correlation Summary
| Measurement | Colombian | Sudanese |
| Minimum | 0.61% | 0.92% |
| Maximum | 17.9% | 13.5% |
| Range | 17.3% | 12.6% |
| Mean | 5.4% | 6.9% |
| Median | 5.2% | 6.7% |
| Interquartile 25% (IQ1) | 4.3% | 6.0% |
| Interquartile 75% (IQ3) | 6.0% | 8.1% |
| Interquartile Range (IQR) | 1.7% | 2.1% |
| Standard Deviation (Sample) | 2.2% | 2.5% |
| Standard Deviation (Population) | 2.2% | 2.5% |
Similar Demographics by Disability Age 18 to 34
Demographics Similar to Colombians by Disability Age 18 to 34
In terms of disability age 18 to 34, the demographic groups most similar to Colombians are South American (5.9%, a difference of 0.020%), Immigrants from Asia (5.9%, a difference of 0.040%), Immigrants from Peru (5.9%, a difference of 0.17%), Nicaraguan (5.8%, a difference of 0.22%), and Immigrants from Korea (5.9%, a difference of 0.30%).
| Demographics | Rating | Rank | Disability Age 18 to 34 |
| Immigrants | Lithuania | 99.9 /100 | #35 | Exceptional 5.8% |
| Ecuadorians | 99.9 /100 | #36 | Exceptional 5.8% |
| Armenians | 99.9 /100 | #37 | Exceptional 5.8% |
| Immigrants | South America | 99.9 /100 | #38 | Exceptional 5.8% |
| Asians | 99.9 /100 | #39 | Exceptional 5.8% |
| Bolivians | 99.9 /100 | #40 | Exceptional 5.8% |
| Nicaraguans | 99.9 /100 | #41 | Exceptional 5.8% |
| Colombians | 99.8 /100 | #42 | Exceptional 5.9% |
| South Americans | 99.8 /100 | #43 | Exceptional 5.9% |
| Immigrants | Asia | 99.8 /100 | #44 | Exceptional 5.9% |
| Immigrants | Peru | 99.8 /100 | #45 | Exceptional 5.9% |
| Immigrants | Korea | 99.8 /100 | #46 | Exceptional 5.9% |
| Immigrants | Egypt | 99.8 /100 | #47 | Exceptional 5.9% |
| Immigrants | Trinidad and Tobago | 99.8 /100 | #48 | Exceptional 5.9% |
| Immigrants | Belarus | 99.8 /100 | #49 | Exceptional 5.9% |
Demographics Similar to Sudanese by Disability Age 18 to 34
In terms of disability age 18 to 34, the demographic groups most similar to Sudanese are Immigrants from Kenya (6.9%, a difference of 0.020%), Ukrainian (6.9%, a difference of 0.070%), Immigrants from Thailand (6.9%, a difference of 0.13%), Hawaiian (6.9%, a difference of 0.14%), and Serbian (6.9%, a difference of 0.29%).
| Demographics | Rating | Rank | Disability Age 18 to 34 |
| Immigrants | Burma/Myanmar | 12.3 /100 | #209 | Poor 6.8% |
| Latvians | 11.1 /100 | #210 | Poor 6.8% |
| Immigrants | Norway | 10.0 /100 | #211 | Tragic 6.8% |
| Luxembourgers | 9.4 /100 | #212 | Tragic 6.9% |
| Immigrants | Western Europe | 9.1 /100 | #213 | Tragic 6.9% |
| Serbians | 8.2 /100 | #214 | Tragic 6.9% |
| Immigrants | Thailand | 7.5 /100 | #215 | Tragic 6.9% |
| Sudanese | 7.0 /100 | #216 | Tragic 6.9% |
| Immigrants | Kenya | 6.9 /100 | #217 | Tragic 6.9% |
| Ukrainians | 6.7 /100 | #218 | Tragic 6.9% |
| Hawaiians | 6.5 /100 | #219 | Tragic 6.9% |
| Immigrants | Senegal | 5.5 /100 | #220 | Tragic 6.9% |
| Immigrants | Middle Africa | 5.5 /100 | #221 | Tragic 6.9% |
| Immigrants | England | 5.3 /100 | #222 | Tragic 6.9% |
| Carpatho Rusyns | 5.2 /100 | #223 | Tragic 6.9% |