Scotch-Irish vs Chinese Disability Age 18 to 34
COMPARE
Scotch-Irish
Chinese
Disability Age 18 to 34
Disability Age 18 to 34 Comparison
Scotch-Irish
Chinese
7.8%
DISABILITY AGE 18 TO 34
0.0/ 100
METRIC RATING
307th/ 347
METRIC RANK
6.3%
DISABILITY AGE 18 TO 34
91.9/ 100
METRIC RATING
128th/ 347
METRIC RANK
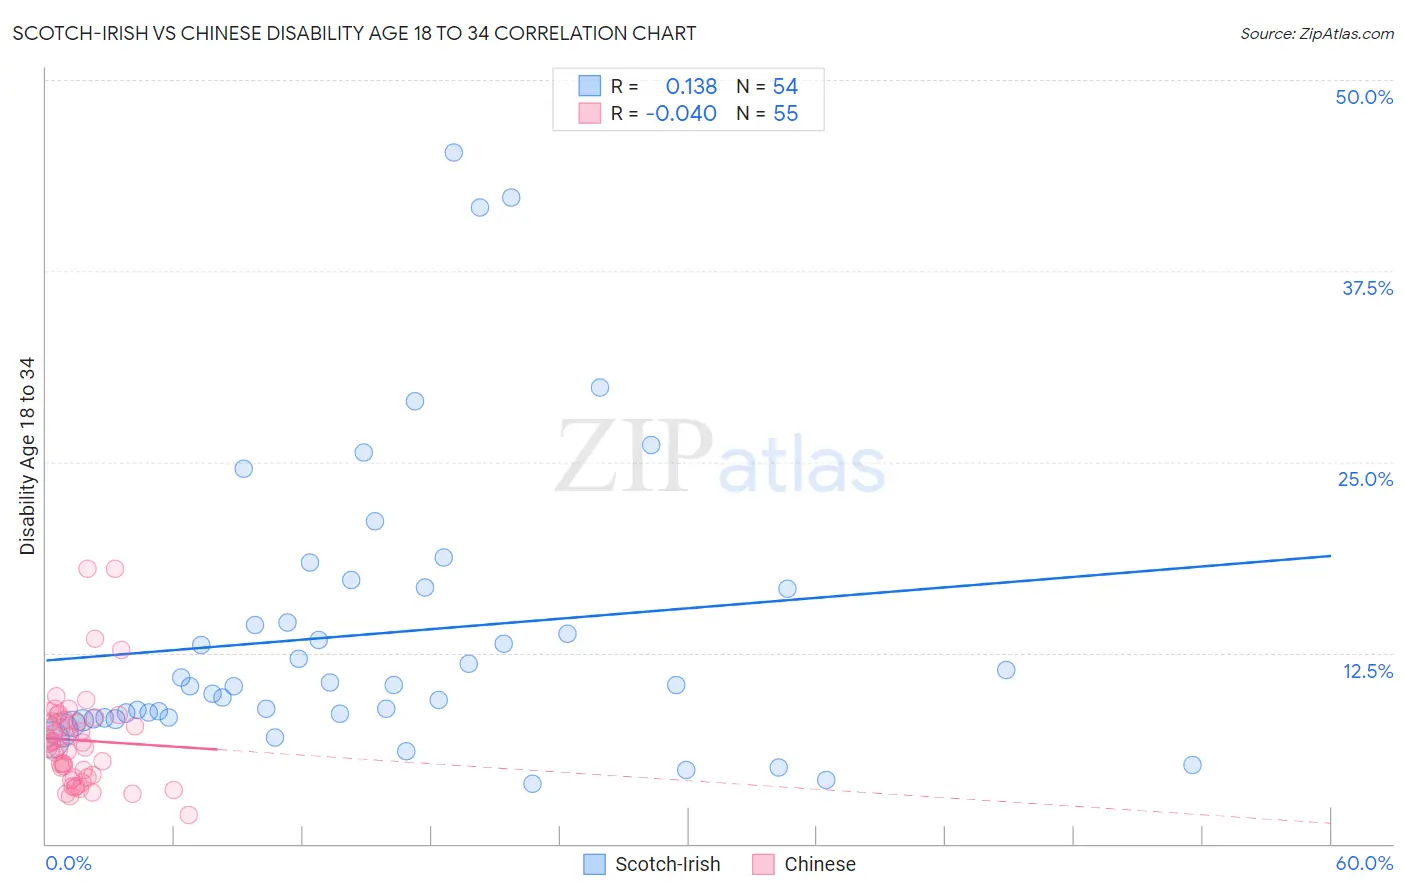
Scotch-Irish vs Chinese Disability Age 18 to 34 Correlation Chart
The statistical analysis conducted on geographies consisting of 544,079,261 people shows a poor positive correlation between the proportion of Scotch-Irish and percentage of population with a disability between the ages 18 and 35 in the United States with a correlation coefficient (R) of 0.138 and weighted average of 7.8%. Similarly, the statistical analysis conducted on geographies consisting of 64,771,320 people shows no correlation between the proportion of Chinese and percentage of population with a disability between the ages 18 and 35 in the United States with a correlation coefficient (R) of -0.040 and weighted average of 6.3%, a difference of 23.5%.
Disability Age 18 to 34 Correlation Summary
| Measurement | Scotch-Irish | Chinese |
| Minimum | 3.9% | 1.9% |
| Maximum | 45.2% | 18.0% |
| Range | 41.3% | 16.1% |
| Mean | 13.7% | 6.8% |
| Median | 10.4% | 6.6% |
| Interquartile 25% (IQ1) | 8.2% | 4.4% |
| Interquartile 75% (IQ3) | 16.7% | 8.1% |
| Interquartile Range (IQR) | 8.4% | 3.8% |
| Standard Deviation (Sample) | 9.4% | 3.2% |
| Standard Deviation (Population) | 9.4% | 3.2% |
Similar Demographics by Disability Age 18 to 34
Demographics Similar to Scotch-Irish by Disability Age 18 to 34
In terms of disability age 18 to 34, the demographic groups most similar to Scotch-Irish are Pennsylvania German (7.8%, a difference of 0.030%), Alaska Native (7.8%, a difference of 0.040%), Finnish (7.8%, a difference of 0.10%), English (7.8%, a difference of 0.26%), and Menominee (7.8%, a difference of 0.34%).
| Demographics | Rating | Rank | Disability Age 18 to 34 |
| Scottish | 0.0 /100 | #300 | Tragic 7.7% |
| Pima | 0.0 /100 | #301 | Tragic 7.7% |
| Welsh | 0.0 /100 | #302 | Tragic 7.7% |
| Cheyenne | 0.0 /100 | #303 | Tragic 7.7% |
| Shoshone | 0.0 /100 | #304 | Tragic 7.8% |
| Menominee | 0.0 /100 | #305 | Tragic 7.8% |
| English | 0.0 /100 | #306 | Tragic 7.8% |
| Scotch-Irish | 0.0 /100 | #307 | Tragic 7.8% |
| Pennsylvania Germans | 0.0 /100 | #308 | Tragic 7.8% |
| Alaska Natives | 0.0 /100 | #309 | Tragic 7.8% |
| Finns | 0.0 /100 | #310 | Tragic 7.8% |
| French | 0.0 /100 | #311 | Tragic 7.9% |
| Spanish Americans | 0.0 /100 | #312 | Tragic 7.9% |
| Iroquois | 0.0 /100 | #313 | Tragic 7.9% |
| Colville | 0.0 /100 | #314 | Tragic 7.9% |
Demographics Similar to Chinese by Disability Age 18 to 34
In terms of disability age 18 to 34, the demographic groups most similar to Chinese are West Indian (6.3%, a difference of 0.010%), Immigrants from Switzerland (6.3%, a difference of 0.15%), Macedonian (6.3%, a difference of 0.18%), Immigrants from Morocco (6.3%, a difference of 0.24%), and Costa Rican (6.3%, a difference of 0.26%).
| Demographics | Rating | Rank | Disability Age 18 to 34 |
| Immigrants | Guatemala | 93.4 /100 | #121 | Exceptional 6.3% |
| Immigrants | Czechoslovakia | 93.3 /100 | #122 | Exceptional 6.3% |
| Costa Ricans | 92.9 /100 | #123 | Exceptional 6.3% |
| Immigrants | Morocco | 92.9 /100 | #124 | Exceptional 6.3% |
| Macedonians | 92.6 /100 | #125 | Exceptional 6.3% |
| Immigrants | Switzerland | 92.5 /100 | #126 | Exceptional 6.3% |
| West Indians | 92.0 /100 | #127 | Exceptional 6.3% |
| Chinese | 91.9 /100 | #128 | Exceptional 6.3% |
| Immigrants | Italy | 90.5 /100 | #129 | Exceptional 6.3% |
| Immigrants | Dominica | 90.5 /100 | #130 | Exceptional 6.3% |
| Immigrants | Saudi Arabia | 90.4 /100 | #131 | Exceptional 6.3% |
| Guatemalans | 89.6 /100 | #132 | Excellent 6.4% |
| Brazilians | 89.0 /100 | #133 | Excellent 6.4% |
| Immigrants | Europe | 88.8 /100 | #134 | Excellent 6.4% |
| Palestinians | 88.5 /100 | #135 | Excellent 6.4% |