Scotch-Irish vs Portuguese Disability Age 18 to 34
COMPARE
Scotch-Irish
Portuguese
Disability Age 18 to 34
Disability Age 18 to 34 Comparison
Scotch-Irish
Portuguese
7.8%
DISABILITY AGE 18 TO 34
0.0/ 100
METRIC RATING
307th/ 347
METRIC RANK
7.4%
DISABILITY AGE 18 TO 34
0.1/ 100
METRIC RATING
268th/ 347
METRIC RANK
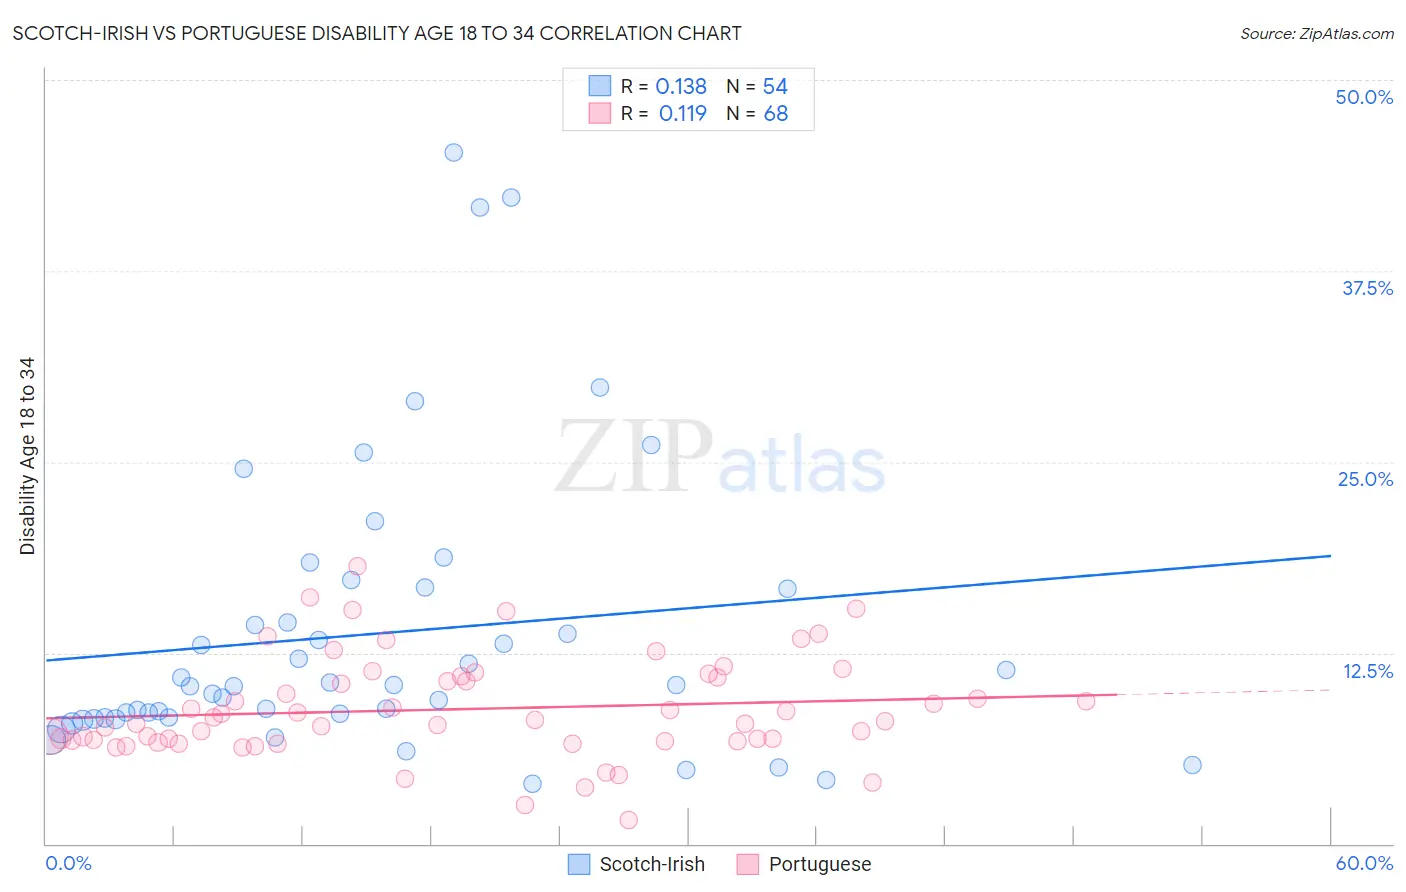
Scotch-Irish vs Portuguese Disability Age 18 to 34 Correlation Chart
The statistical analysis conducted on geographies consisting of 544,079,261 people shows a poor positive correlation between the proportion of Scotch-Irish and percentage of population with a disability between the ages 18 and 35 in the United States with a correlation coefficient (R) of 0.138 and weighted average of 7.8%. Similarly, the statistical analysis conducted on geographies consisting of 448,622,117 people shows a poor positive correlation between the proportion of Portuguese and percentage of population with a disability between the ages 18 and 35 in the United States with a correlation coefficient (R) of 0.119 and weighted average of 7.4%, a difference of 5.9%.
Disability Age 18 to 34 Correlation Summary
| Measurement | Scotch-Irish | Portuguese |
| Minimum | 3.9% | 1.6% |
| Maximum | 45.2% | 18.2% |
| Range | 41.3% | 16.6% |
| Mean | 13.7% | 8.8% |
| Median | 10.4% | 8.1% |
| Interquartile 25% (IQ1) | 8.2% | 6.7% |
| Interquartile 75% (IQ3) | 16.7% | 10.9% |
| Interquartile Range (IQR) | 8.4% | 4.2% |
| Standard Deviation (Sample) | 9.4% | 3.3% |
| Standard Deviation (Population) | 9.4% | 3.3% |
Similar Demographics by Disability Age 18 to 34
Demographics Similar to Scotch-Irish by Disability Age 18 to 34
In terms of disability age 18 to 34, the demographic groups most similar to Scotch-Irish are Pennsylvania German (7.8%, a difference of 0.030%), Alaska Native (7.8%, a difference of 0.040%), Finnish (7.8%, a difference of 0.10%), English (7.8%, a difference of 0.26%), and Menominee (7.8%, a difference of 0.34%).
| Demographics | Rating | Rank | Disability Age 18 to 34 |
| Scottish | 0.0 /100 | #300 | Tragic 7.7% |
| Pima | 0.0 /100 | #301 | Tragic 7.7% |
| Welsh | 0.0 /100 | #302 | Tragic 7.7% |
| Cheyenne | 0.0 /100 | #303 | Tragic 7.7% |
| Shoshone | 0.0 /100 | #304 | Tragic 7.8% |
| Menominee | 0.0 /100 | #305 | Tragic 7.8% |
| English | 0.0 /100 | #306 | Tragic 7.8% |
| Scotch-Irish | 0.0 /100 | #307 | Tragic 7.8% |
| Pennsylvania Germans | 0.0 /100 | #308 | Tragic 7.8% |
| Alaska Natives | 0.0 /100 | #309 | Tragic 7.8% |
| Finns | 0.0 /100 | #310 | Tragic 7.8% |
| French | 0.0 /100 | #311 | Tragic 7.9% |
| Spanish Americans | 0.0 /100 | #312 | Tragic 7.9% |
| Iroquois | 0.0 /100 | #313 | Tragic 7.9% |
| Colville | 0.0 /100 | #314 | Tragic 7.9% |
Demographics Similar to Portuguese by Disability Age 18 to 34
In terms of disability age 18 to 34, the demographic groups most similar to Portuguese are Basque (7.4%, a difference of 0.040%), Bangladeshi (7.4%, a difference of 0.080%), Belgian (7.4%, a difference of 0.13%), German Russian (7.4%, a difference of 0.14%), and Swiss (7.4%, a difference of 0.18%).
| Demographics | Rating | Rank | Disability Age 18 to 34 |
| Northern Europeans | 0.2 /100 | #261 | Tragic 7.3% |
| Canadians | 0.2 /100 | #262 | Tragic 7.3% |
| British | 0.2 /100 | #263 | Tragic 7.3% |
| Bermudans | 0.1 /100 | #264 | Tragic 7.3% |
| Slovenes | 0.1 /100 | #265 | Tragic 7.3% |
| German Russians | 0.1 /100 | #266 | Tragic 7.4% |
| Bangladeshis | 0.1 /100 | #267 | Tragic 7.4% |
| Portuguese | 0.1 /100 | #268 | Tragic 7.4% |
| Basques | 0.1 /100 | #269 | Tragic 7.4% |
| Belgians | 0.1 /100 | #270 | Tragic 7.4% |
| Swiss | 0.1 /100 | #271 | Tragic 7.4% |
| Tsimshian | 0.1 /100 | #272 | Tragic 7.4% |
| Slavs | 0.1 /100 | #273 | Tragic 7.4% |
| Africans | 0.1 /100 | #274 | Tragic 7.4% |
| Immigrants | Somalia | 0.1 /100 | #275 | Tragic 7.4% |