Scotch-Irish vs Israeli Disability Age 18 to 34
COMPARE
Scotch-Irish
Israeli
Disability Age 18 to 34
Disability Age 18 to 34 Comparison
Scotch-Irish
Israelis
7.8%
DISABILITY AGE 18 TO 34
0.0/ 100
METRIC RATING
307th/ 347
METRIC RANK
6.1%
DISABILITY AGE 18 TO 34
98.3/ 100
METRIC RATING
84th/ 347
METRIC RANK
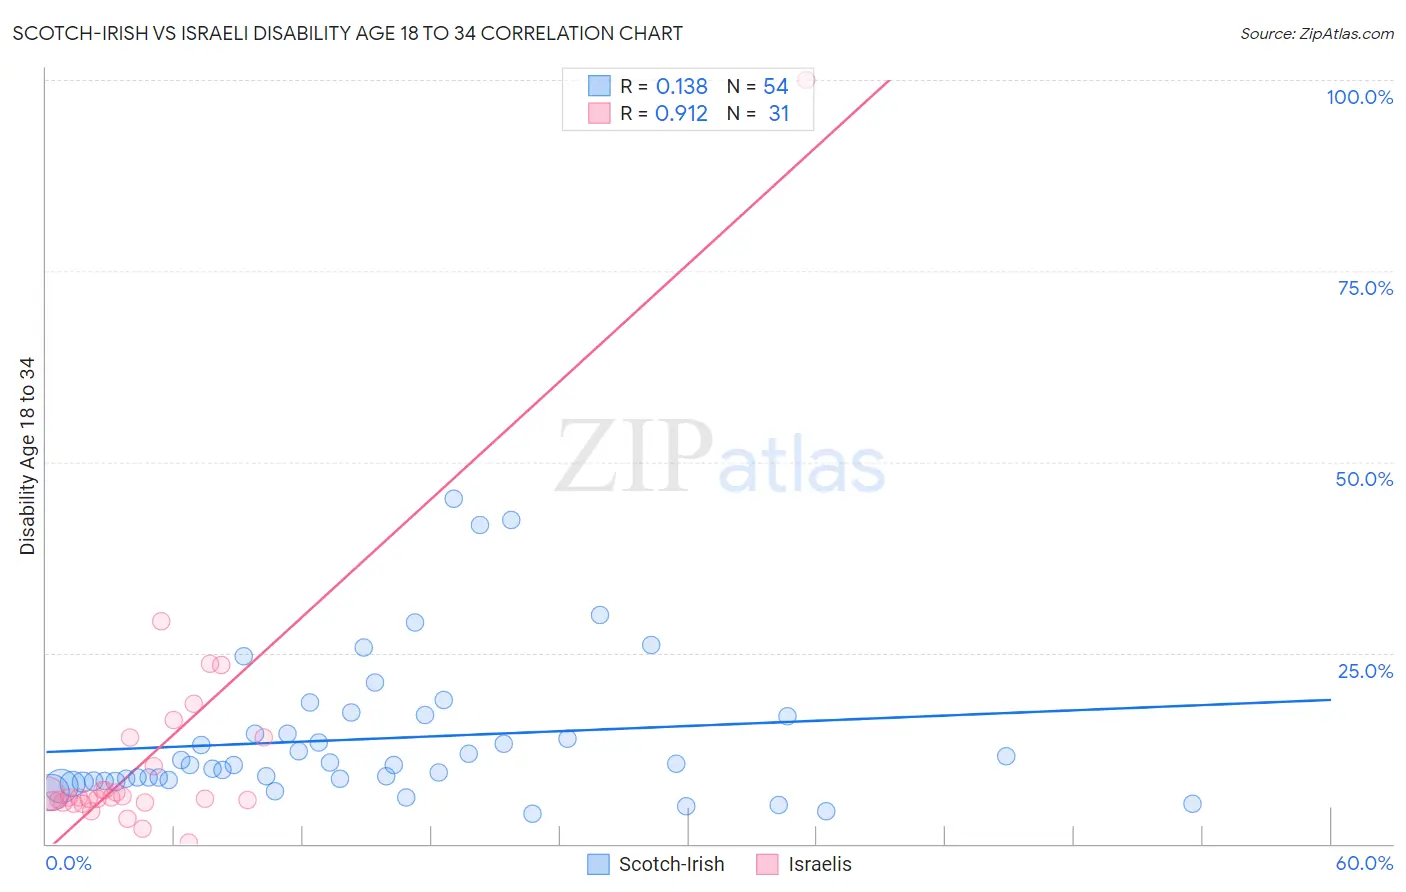
Scotch-Irish vs Israeli Disability Age 18 to 34 Correlation Chart
The statistical analysis conducted on geographies consisting of 544,079,261 people shows a poor positive correlation between the proportion of Scotch-Irish and percentage of population with a disability between the ages 18 and 35 in the United States with a correlation coefficient (R) of 0.138 and weighted average of 7.8%. Similarly, the statistical analysis conducted on geographies consisting of 210,930,100 people shows a near-perfect positive correlation between the proportion of Israelis and percentage of population with a disability between the ages 18 and 35 in the United States with a correlation coefficient (R) of 0.912 and weighted average of 6.1%, a difference of 27.2%.
Disability Age 18 to 34 Correlation Summary
| Measurement | Scotch-Irish | Israeli |
| Minimum | 3.9% | 0.20% |
| Maximum | 45.2% | 100.0% |
| Range | 41.3% | 99.8% |
| Mean | 13.7% | 11.8% |
| Median | 10.4% | 6.0% |
| Interquartile 25% (IQ1) | 8.2% | 5.4% |
| Interquartile 75% (IQ3) | 16.7% | 13.8% |
| Interquartile Range (IQR) | 8.4% | 8.4% |
| Standard Deviation (Sample) | 9.4% | 17.7% |
| Standard Deviation (Population) | 9.4% | 17.4% |
Similar Demographics by Disability Age 18 to 34
Demographics Similar to Scotch-Irish by Disability Age 18 to 34
In terms of disability age 18 to 34, the demographic groups most similar to Scotch-Irish are Pennsylvania German (7.8%, a difference of 0.030%), Alaska Native (7.8%, a difference of 0.040%), Finnish (7.8%, a difference of 0.10%), English (7.8%, a difference of 0.26%), and Menominee (7.8%, a difference of 0.34%).
| Demographics | Rating | Rank | Disability Age 18 to 34 |
| Scottish | 0.0 /100 | #300 | Tragic 7.7% |
| Pima | 0.0 /100 | #301 | Tragic 7.7% |
| Welsh | 0.0 /100 | #302 | Tragic 7.7% |
| Cheyenne | 0.0 /100 | #303 | Tragic 7.7% |
| Shoshone | 0.0 /100 | #304 | Tragic 7.8% |
| Menominee | 0.0 /100 | #305 | Tragic 7.8% |
| English | 0.0 /100 | #306 | Tragic 7.8% |
| Scotch-Irish | 0.0 /100 | #307 | Tragic 7.8% |
| Pennsylvania Germans | 0.0 /100 | #308 | Tragic 7.8% |
| Alaska Natives | 0.0 /100 | #309 | Tragic 7.8% |
| Finns | 0.0 /100 | #310 | Tragic 7.8% |
| French | 0.0 /100 | #311 | Tragic 7.9% |
| Spanish Americans | 0.0 /100 | #312 | Tragic 7.9% |
| Iroquois | 0.0 /100 | #313 | Tragic 7.9% |
| Colville | 0.0 /100 | #314 | Tragic 7.9% |
Demographics Similar to Israelis by Disability Age 18 to 34
In terms of disability age 18 to 34, the demographic groups most similar to Israelis are Barbadian (6.1%, a difference of 0.030%), Immigrants from Ireland (6.1%, a difference of 0.080%), Immigrants from Northern Africa (6.1%, a difference of 0.10%), Immigrants from Australia (6.1%, a difference of 0.28%), and Immigrants from Kuwait (6.2%, a difference of 0.30%).
| Demographics | Rating | Rank | Disability Age 18 to 34 |
| Immigrants | Russia | 98.9 /100 | #77 | Exceptional 6.1% |
| Assyrians/Chaldeans/Syriacs | 98.9 /100 | #78 | Exceptional 6.1% |
| Afghans | 98.7 /100 | #79 | Exceptional 6.1% |
| Immigrants | Chile | 98.5 /100 | #80 | Exceptional 6.1% |
| Immigrants | Australia | 98.5 /100 | #81 | Exceptional 6.1% |
| Immigrants | Northern Africa | 98.4 /100 | #82 | Exceptional 6.1% |
| Barbadians | 98.3 /100 | #83 | Exceptional 6.1% |
| Israelis | 98.3 /100 | #84 | Exceptional 6.1% |
| Immigrants | Ireland | 98.2 /100 | #85 | Exceptional 6.1% |
| Immigrants | Kuwait | 98.0 /100 | #86 | Exceptional 6.2% |
| Immigrants | Eastern Europe | 97.9 /100 | #87 | Exceptional 6.2% |
| Cambodians | 97.8 /100 | #88 | Exceptional 6.2% |
| Turks | 97.8 /100 | #89 | Exceptional 6.2% |
| Immigrants | Vietnam | 97.7 /100 | #90 | Exceptional 6.2% |
| Immigrants | Philippines | 97.6 /100 | #91 | Exceptional 6.2% |