Scotch-Irish vs Senegalese Disability Age 18 to 34
COMPARE
Scotch-Irish
Senegalese
Disability Age 18 to 34
Disability Age 18 to 34 Comparison
Scotch-Irish
Senegalese
7.8%
DISABILITY AGE 18 TO 34
0.0/ 100
METRIC RATING
307th/ 347
METRIC RANK
6.9%
DISABILITY AGE 18 TO 34
4.9/ 100
METRIC RATING
224th/ 347
METRIC RANK
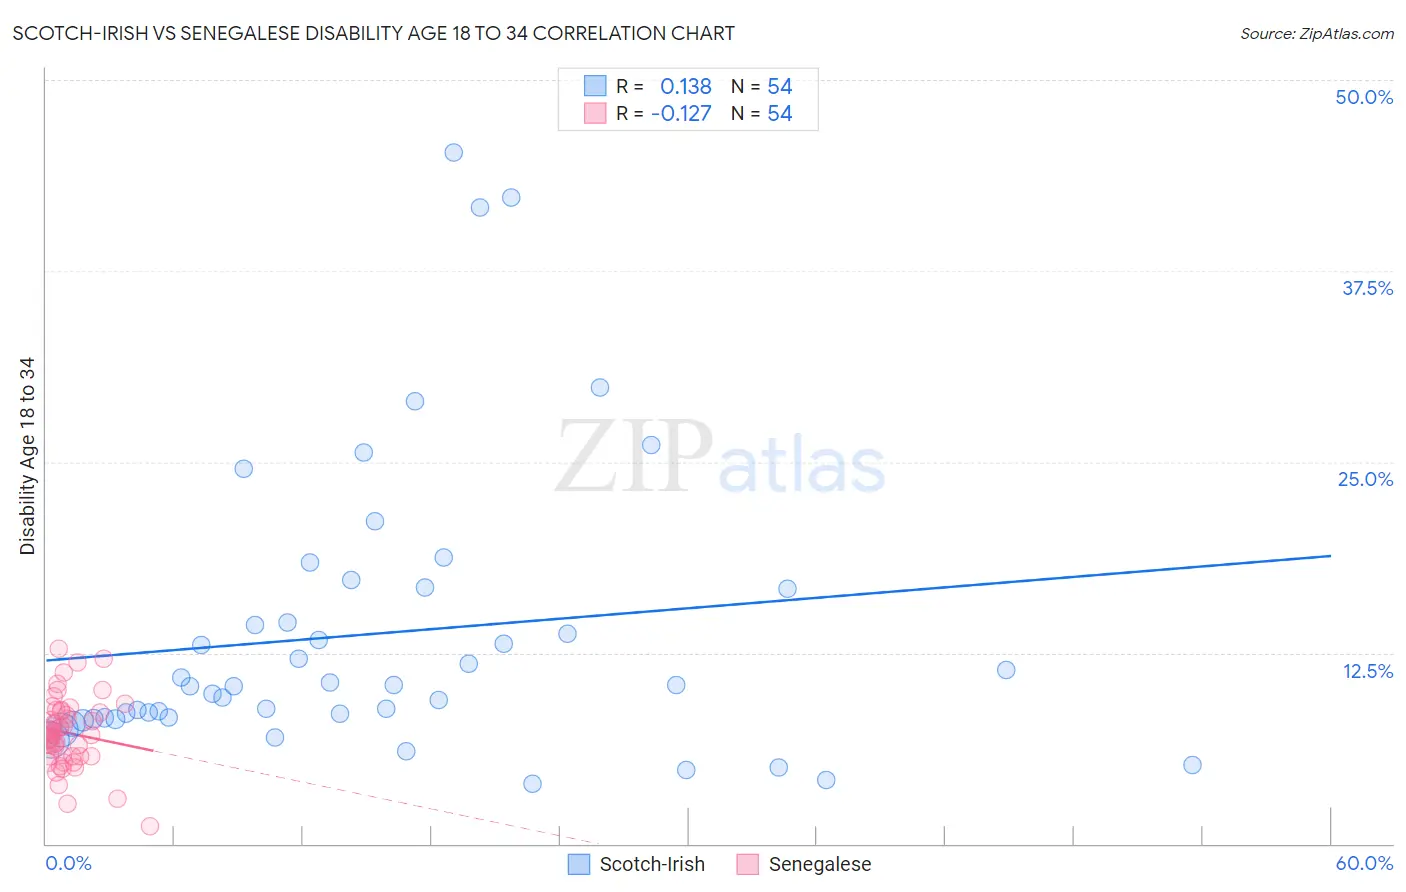
Scotch-Irish vs Senegalese Disability Age 18 to 34 Correlation Chart
The statistical analysis conducted on geographies consisting of 544,079,261 people shows a poor positive correlation between the proportion of Scotch-Irish and percentage of population with a disability between the ages 18 and 35 in the United States with a correlation coefficient (R) of 0.138 and weighted average of 7.8%. Similarly, the statistical analysis conducted on geographies consisting of 78,132,193 people shows a poor negative correlation between the proportion of Senegalese and percentage of population with a disability between the ages 18 and 35 in the United States with a correlation coefficient (R) of -0.127 and weighted average of 6.9%, a difference of 12.5%.
Disability Age 18 to 34 Correlation Summary
| Measurement | Scotch-Irish | Senegalese |
| Minimum | 3.9% | 1.2% |
| Maximum | 45.2% | 12.8% |
| Range | 41.3% | 11.6% |
| Mean | 13.7% | 7.3% |
| Median | 10.4% | 7.2% |
| Interquartile 25% (IQ1) | 8.2% | 5.7% |
| Interquartile 75% (IQ3) | 16.7% | 8.7% |
| Interquartile Range (IQR) | 8.4% | 2.9% |
| Standard Deviation (Sample) | 9.4% | 2.3% |
| Standard Deviation (Population) | 9.4% | 2.3% |
Similar Demographics by Disability Age 18 to 34
Demographics Similar to Scotch-Irish by Disability Age 18 to 34
In terms of disability age 18 to 34, the demographic groups most similar to Scotch-Irish are Pennsylvania German (7.8%, a difference of 0.030%), Alaska Native (7.8%, a difference of 0.040%), Finnish (7.8%, a difference of 0.10%), English (7.8%, a difference of 0.26%), and Menominee (7.8%, a difference of 0.34%).
| Demographics | Rating | Rank | Disability Age 18 to 34 |
| Scottish | 0.0 /100 | #300 | Tragic 7.7% |
| Pima | 0.0 /100 | #301 | Tragic 7.7% |
| Welsh | 0.0 /100 | #302 | Tragic 7.7% |
| Cheyenne | 0.0 /100 | #303 | Tragic 7.7% |
| Shoshone | 0.0 /100 | #304 | Tragic 7.8% |
| Menominee | 0.0 /100 | #305 | Tragic 7.8% |
| English | 0.0 /100 | #306 | Tragic 7.8% |
| Scotch-Irish | 0.0 /100 | #307 | Tragic 7.8% |
| Pennsylvania Germans | 0.0 /100 | #308 | Tragic 7.8% |
| Alaska Natives | 0.0 /100 | #309 | Tragic 7.8% |
| Finns | 0.0 /100 | #310 | Tragic 7.8% |
| French | 0.0 /100 | #311 | Tragic 7.9% |
| Spanish Americans | 0.0 /100 | #312 | Tragic 7.9% |
| Iroquois | 0.0 /100 | #313 | Tragic 7.9% |
| Colville | 0.0 /100 | #314 | Tragic 7.9% |
Demographics Similar to Senegalese by Disability Age 18 to 34
In terms of disability age 18 to 34, the demographic groups most similar to Senegalese are Carpatho Rusyn (6.9%, a difference of 0.090%), Central American Indian (6.9%, a difference of 0.090%), Immigrants from England (6.9%, a difference of 0.12%), Immigrants from Middle Africa (6.9%, a difference of 0.19%), and Ugandan (6.9%, a difference of 0.19%).
| Demographics | Rating | Rank | Disability Age 18 to 34 |
| Immigrants | Kenya | 6.9 /100 | #217 | Tragic 6.9% |
| Ukrainians | 6.7 /100 | #218 | Tragic 6.9% |
| Hawaiians | 6.5 /100 | #219 | Tragic 6.9% |
| Immigrants | Senegal | 5.5 /100 | #220 | Tragic 6.9% |
| Immigrants | Middle Africa | 5.5 /100 | #221 | Tragic 6.9% |
| Immigrants | England | 5.3 /100 | #222 | Tragic 6.9% |
| Carpatho Rusyns | 5.2 /100 | #223 | Tragic 6.9% |
| Senegalese | 4.9 /100 | #224 | Tragic 6.9% |
| Central American Indians | 4.7 /100 | #225 | Tragic 6.9% |
| Ugandans | 4.4 /100 | #226 | Tragic 6.9% |
| Immigrants | Canada | 4.3 /100 | #227 | Tragic 7.0% |
| Immigrants | Yemen | 4.2 /100 | #228 | Tragic 7.0% |
| Lithuanians | 4.1 /100 | #229 | Tragic 7.0% |
| Immigrants | North America | 3.9 /100 | #230 | Tragic 7.0% |
| Ute | 3.8 /100 | #231 | Tragic 7.0% |