Trinidadian and Tobagonian vs Sudanese Disability Age 18 to 34
COMPARE
Trinidadian and Tobagonian
Sudanese
Disability Age 18 to 34
Disability Age 18 to 34 Comparison
Trinidadians and Tobagonians
Sudanese
6.0%
DISABILITY AGE 18 TO 34
99.5/ 100
METRIC RATING
65th/ 347
METRIC RANK
6.9%
DISABILITY AGE 18 TO 34
7.0/ 100
METRIC RATING
216th/ 347
METRIC RANK
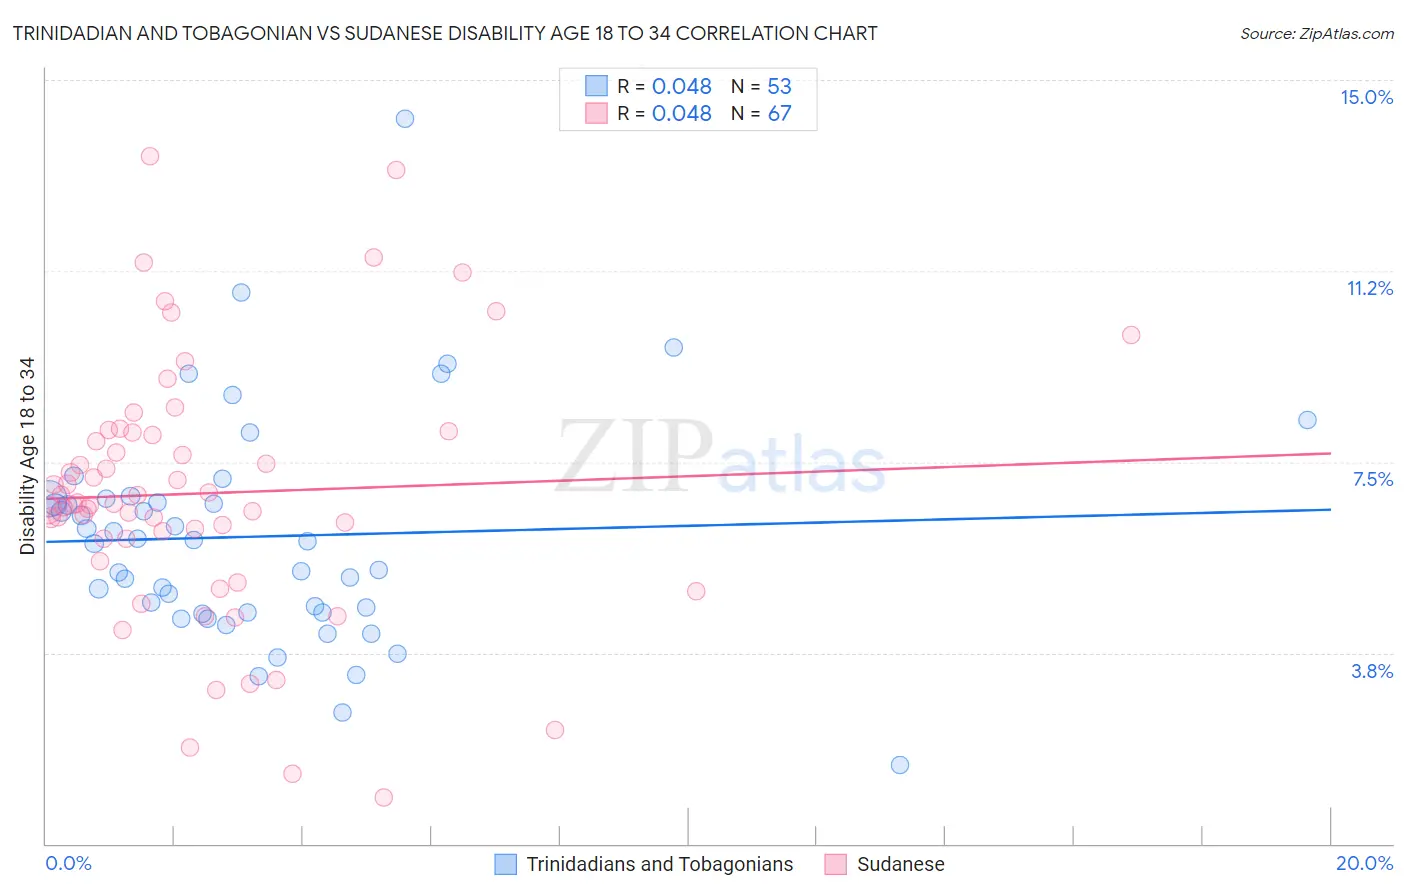
Trinidadian and Tobagonian vs Sudanese Disability Age 18 to 34 Correlation Chart
The statistical analysis conducted on geographies consisting of 219,707,802 people shows no correlation between the proportion of Trinidadians and Tobagonians and percentage of population with a disability between the ages 18 and 35 in the United States with a correlation coefficient (R) of 0.048 and weighted average of 6.0%. Similarly, the statistical analysis conducted on geographies consisting of 110,108,179 people shows no correlation between the proportion of Sudanese and percentage of population with a disability between the ages 18 and 35 in the United States with a correlation coefficient (R) of 0.048 and weighted average of 6.9%, a difference of 15.2%.
Disability Age 18 to 34 Correlation Summary
| Measurement | Trinidadian and Tobagonian | Sudanese |
| Minimum | 1.5% | 0.92% |
| Maximum | 14.3% | 13.5% |
| Range | 12.7% | 12.6% |
| Mean | 6.0% | 6.9% |
| Median | 5.9% | 6.7% |
| Interquartile 25% (IQ1) | 4.5% | 6.0% |
| Interquartile 75% (IQ3) | 6.8% | 8.1% |
| Interquartile Range (IQR) | 2.2% | 2.1% |
| Standard Deviation (Sample) | 2.2% | 2.5% |
| Standard Deviation (Population) | 2.2% | 2.5% |
Similar Demographics by Disability Age 18 to 34
Demographics Similar to Trinidadians and Tobagonians by Disability Age 18 to 34
In terms of disability age 18 to 34, the demographic groups most similar to Trinidadians and Tobagonians are Taiwanese (6.0%, a difference of 0.14%), Burmese (6.0%, a difference of 0.14%), Salvadoran (6.0%, a difference of 0.15%), Immigrants from North Macedonia (6.0%, a difference of 0.18%), and Peruvian (6.0%, a difference of 0.21%).
| Demographics | Rating | Rank | Disability Age 18 to 34 |
| Immigrants | Serbia | 99.7 /100 | #58 | Exceptional 5.9% |
| Immigrants | Caribbean | 99.6 /100 | #59 | Exceptional 6.0% |
| Immigrants | Sri Lanka | 99.6 /100 | #60 | Exceptional 6.0% |
| British West Indians | 99.6 /100 | #61 | Exceptional 6.0% |
| Peruvians | 99.6 /100 | #62 | Exceptional 6.0% |
| Salvadorans | 99.6 /100 | #63 | Exceptional 6.0% |
| Taiwanese | 99.6 /100 | #64 | Exceptional 6.0% |
| Trinidadians and Tobagonians | 99.5 /100 | #65 | Exceptional 6.0% |
| Burmese | 99.5 /100 | #66 | Exceptional 6.0% |
| Immigrants | North Macedonia | 99.5 /100 | #67 | Exceptional 6.0% |
| Immigrants | Poland | 99.5 /100 | #68 | Exceptional 6.0% |
| Immigrants | West Indies | 99.4 /100 | #69 | Exceptional 6.0% |
| Immigrants | Greece | 99.4 /100 | #70 | Exceptional 6.0% |
| Immigrants | Japan | 99.3 /100 | #71 | Exceptional 6.0% |
| Immigrants | Lebanon | 99.2 /100 | #72 | Exceptional 6.0% |
Demographics Similar to Sudanese by Disability Age 18 to 34
In terms of disability age 18 to 34, the demographic groups most similar to Sudanese are Immigrants from Kenya (6.9%, a difference of 0.020%), Ukrainian (6.9%, a difference of 0.070%), Immigrants from Thailand (6.9%, a difference of 0.13%), Hawaiian (6.9%, a difference of 0.14%), and Serbian (6.9%, a difference of 0.29%).
| Demographics | Rating | Rank | Disability Age 18 to 34 |
| Immigrants | Burma/Myanmar | 12.3 /100 | #209 | Poor 6.8% |
| Latvians | 11.1 /100 | #210 | Poor 6.8% |
| Immigrants | Norway | 10.0 /100 | #211 | Tragic 6.8% |
| Luxembourgers | 9.4 /100 | #212 | Tragic 6.9% |
| Immigrants | Western Europe | 9.1 /100 | #213 | Tragic 6.9% |
| Serbians | 8.2 /100 | #214 | Tragic 6.9% |
| Immigrants | Thailand | 7.5 /100 | #215 | Tragic 6.9% |
| Sudanese | 7.0 /100 | #216 | Tragic 6.9% |
| Immigrants | Kenya | 6.9 /100 | #217 | Tragic 6.9% |
| Ukrainians | 6.7 /100 | #218 | Tragic 6.9% |
| Hawaiians | 6.5 /100 | #219 | Tragic 6.9% |
| Immigrants | Senegal | 5.5 /100 | #220 | Tragic 6.9% |
| Immigrants | Middle Africa | 5.5 /100 | #221 | Tragic 6.9% |
| Immigrants | England | 5.3 /100 | #222 | Tragic 6.9% |
| Carpatho Rusyns | 5.2 /100 | #223 | Tragic 6.9% |